Helping Advertisers Find the Data They Need, Faster
Summary
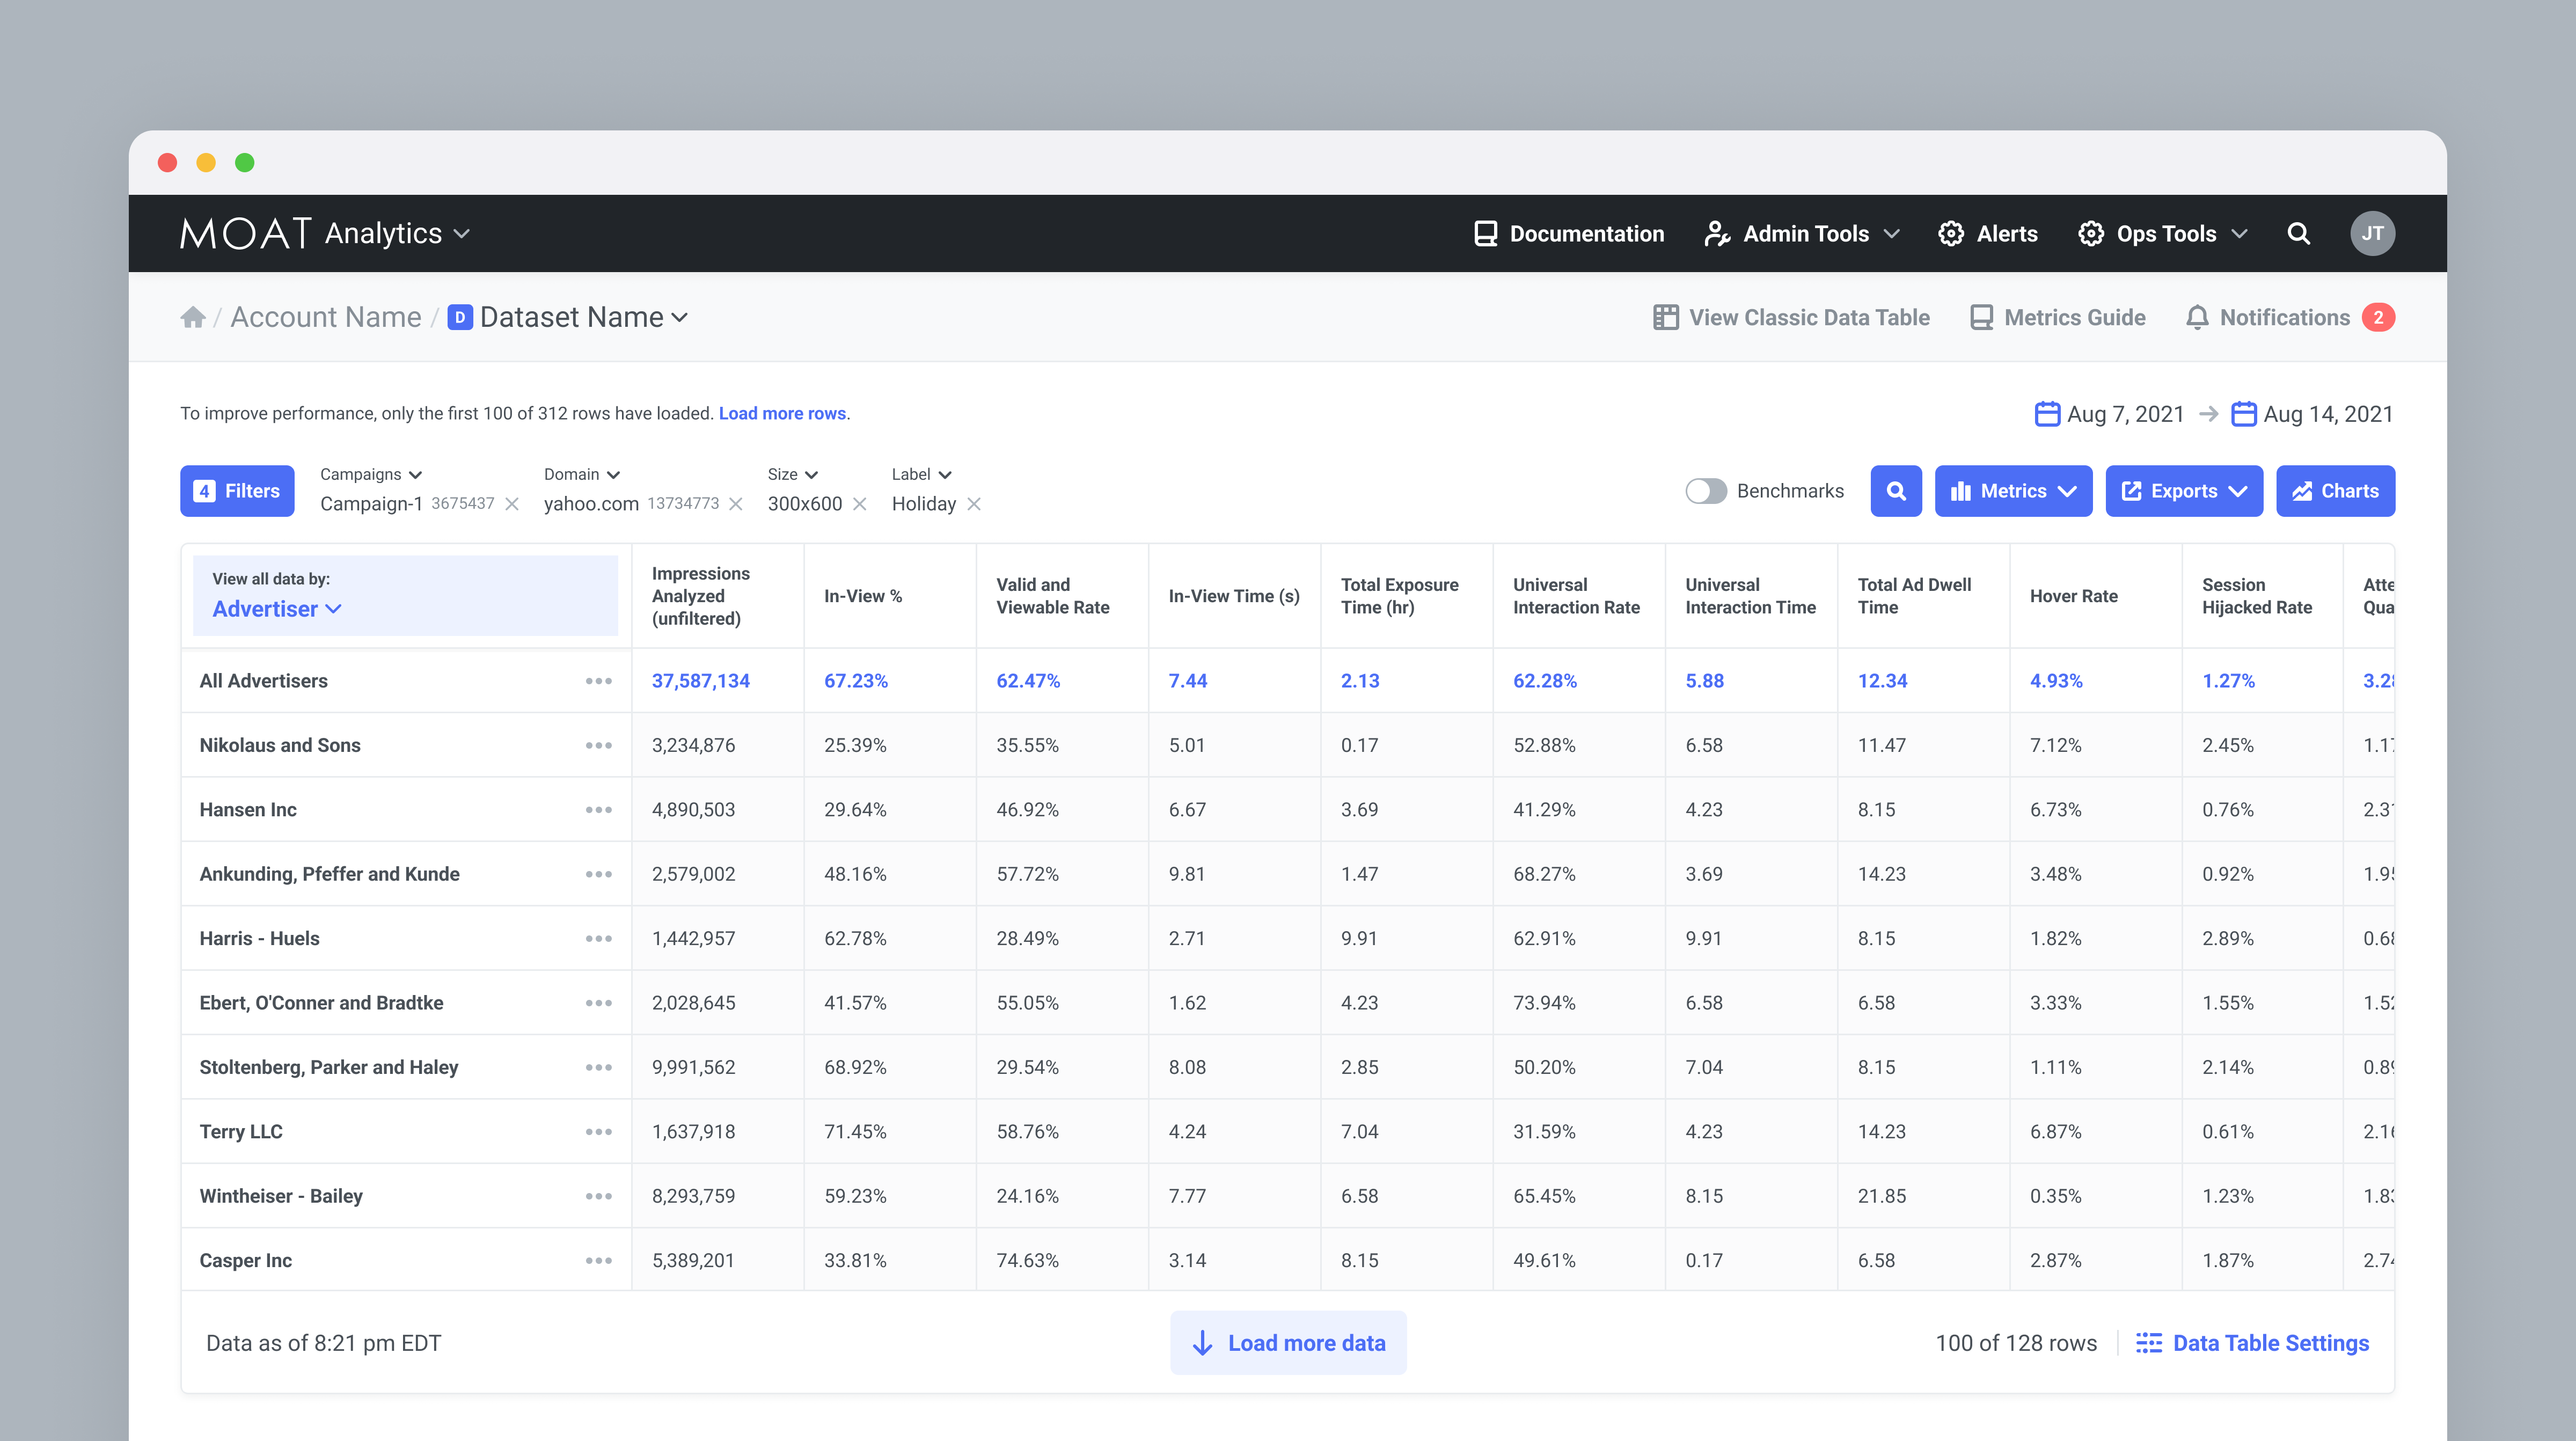
Redesign of Moat Analytics' core dashboard to reduce time-to-insight and help advertising professionals isolate actionable data faster.
Client: Moat Analytics
Role: Lead product designer
Impact: Faster data exploration increased product satisfaction.
Timeline: 2020
The Challenge
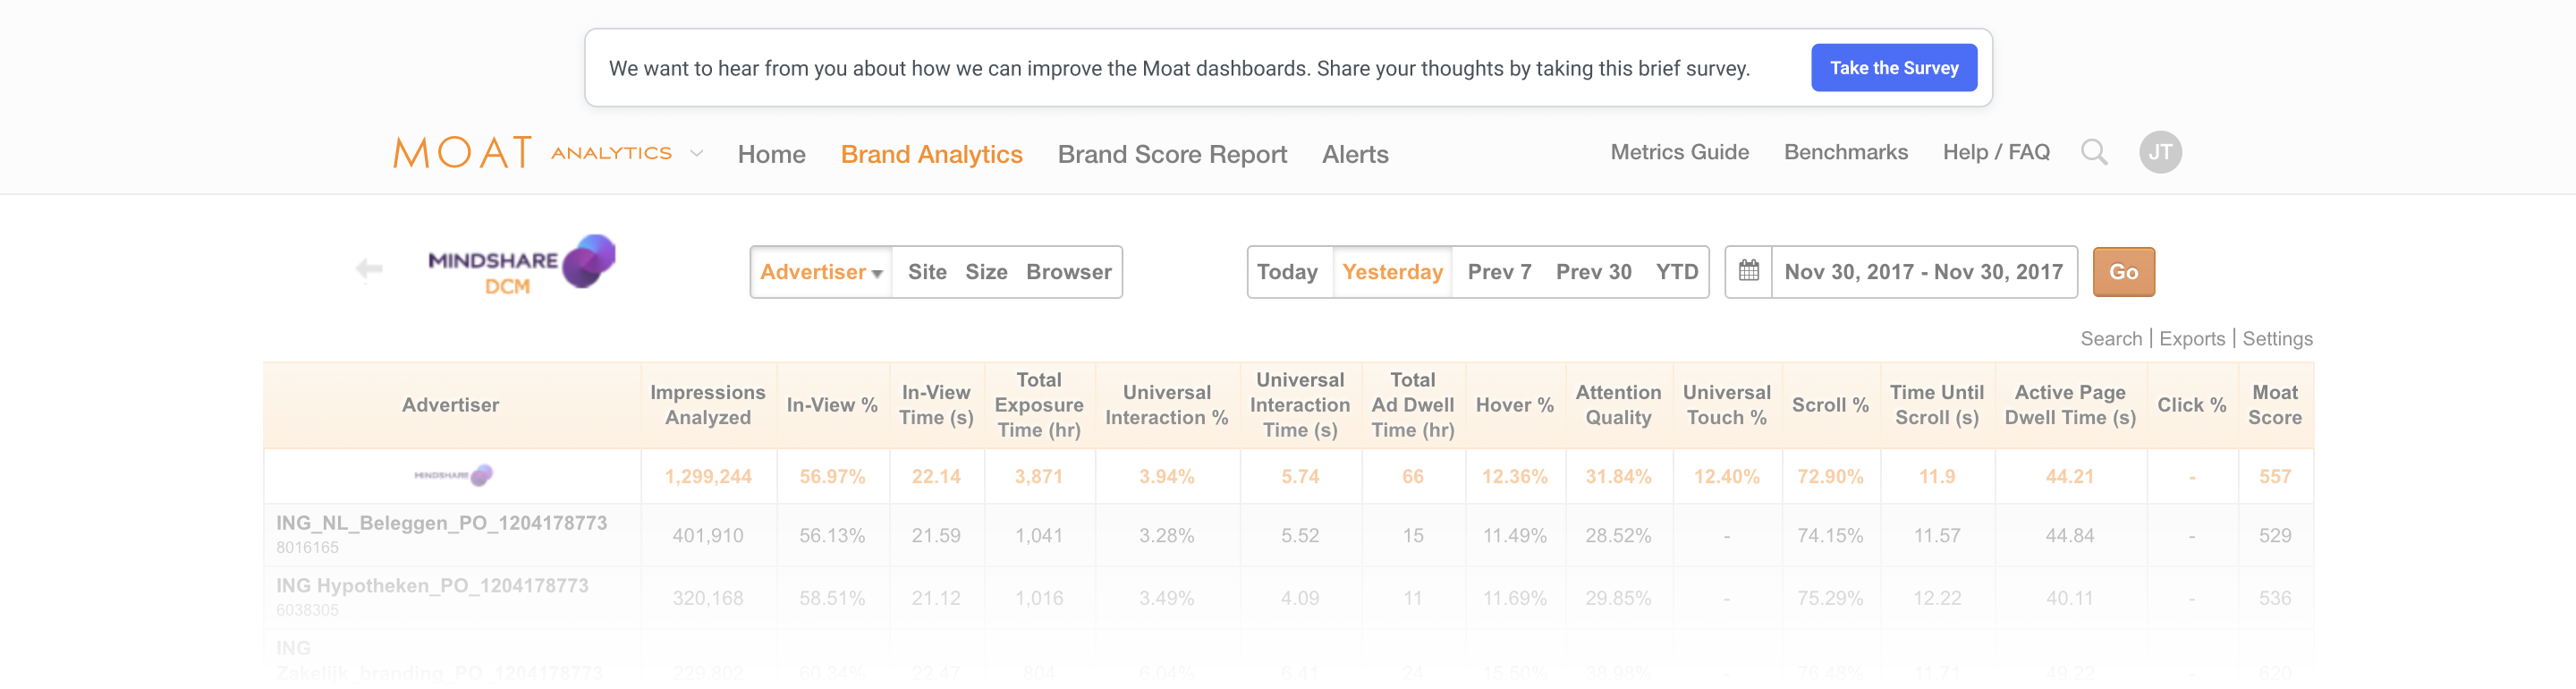
Moat Analytics was a powerhouse for digital advertising measurement, but the core reporting tools, where users spent most of their time, could no longer keep up with evolving customer needs and growing campaign complexity.
Feedback from the go-to-market team indicated users were struggling to find core features and access their data, leading to frustration and a growing reliance on manual exports.
Going to the Source
To move beyond anecdotal evidence, we launched an in-product intercept survey inside the reporting environment. By targeting active users mid-workflow, we aimed to collect higher-quality, more contextual feedback.
We collected responses from 121 users over three weeks, then ran a thematic analysis on the open-ended answers to surface patterns and rank priorities.
A 67% completion rate on open-ended questions made two things clear: there were real usability problems, and users cared enough to say so.
Four priorities emerged from the synthesis:
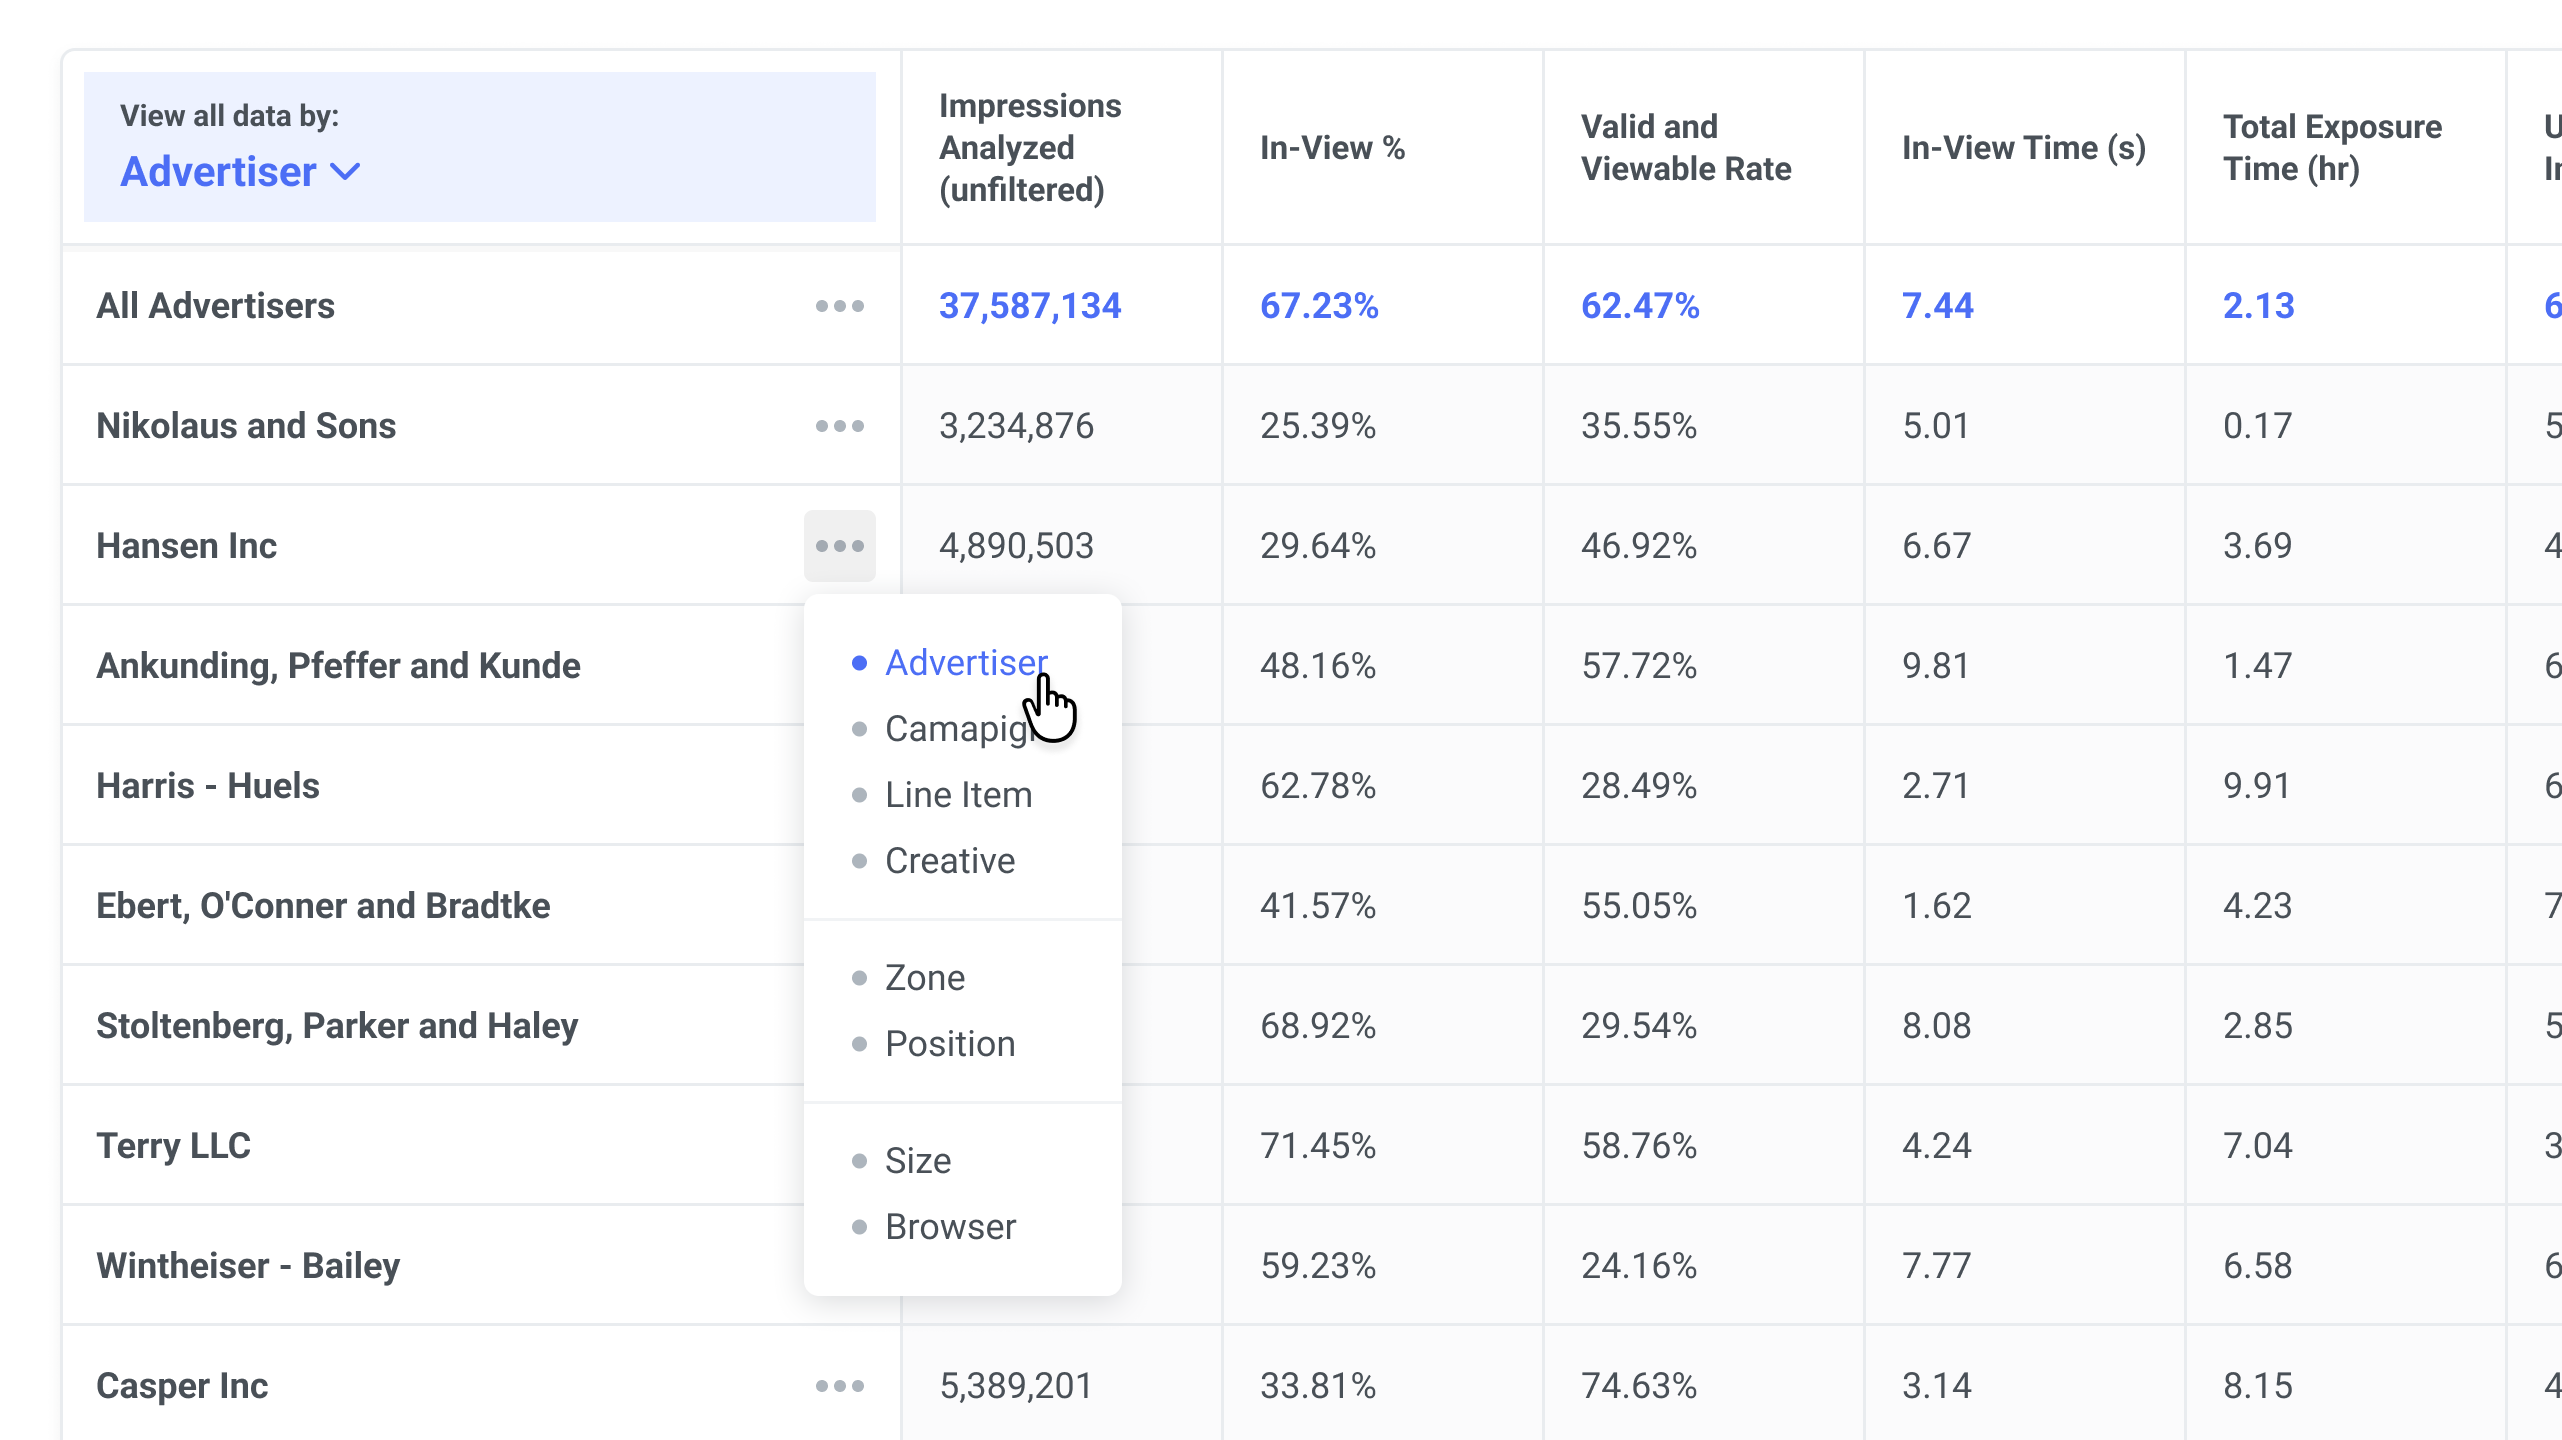
- Frictionless navigation: Faster exploration of data hierarchies.
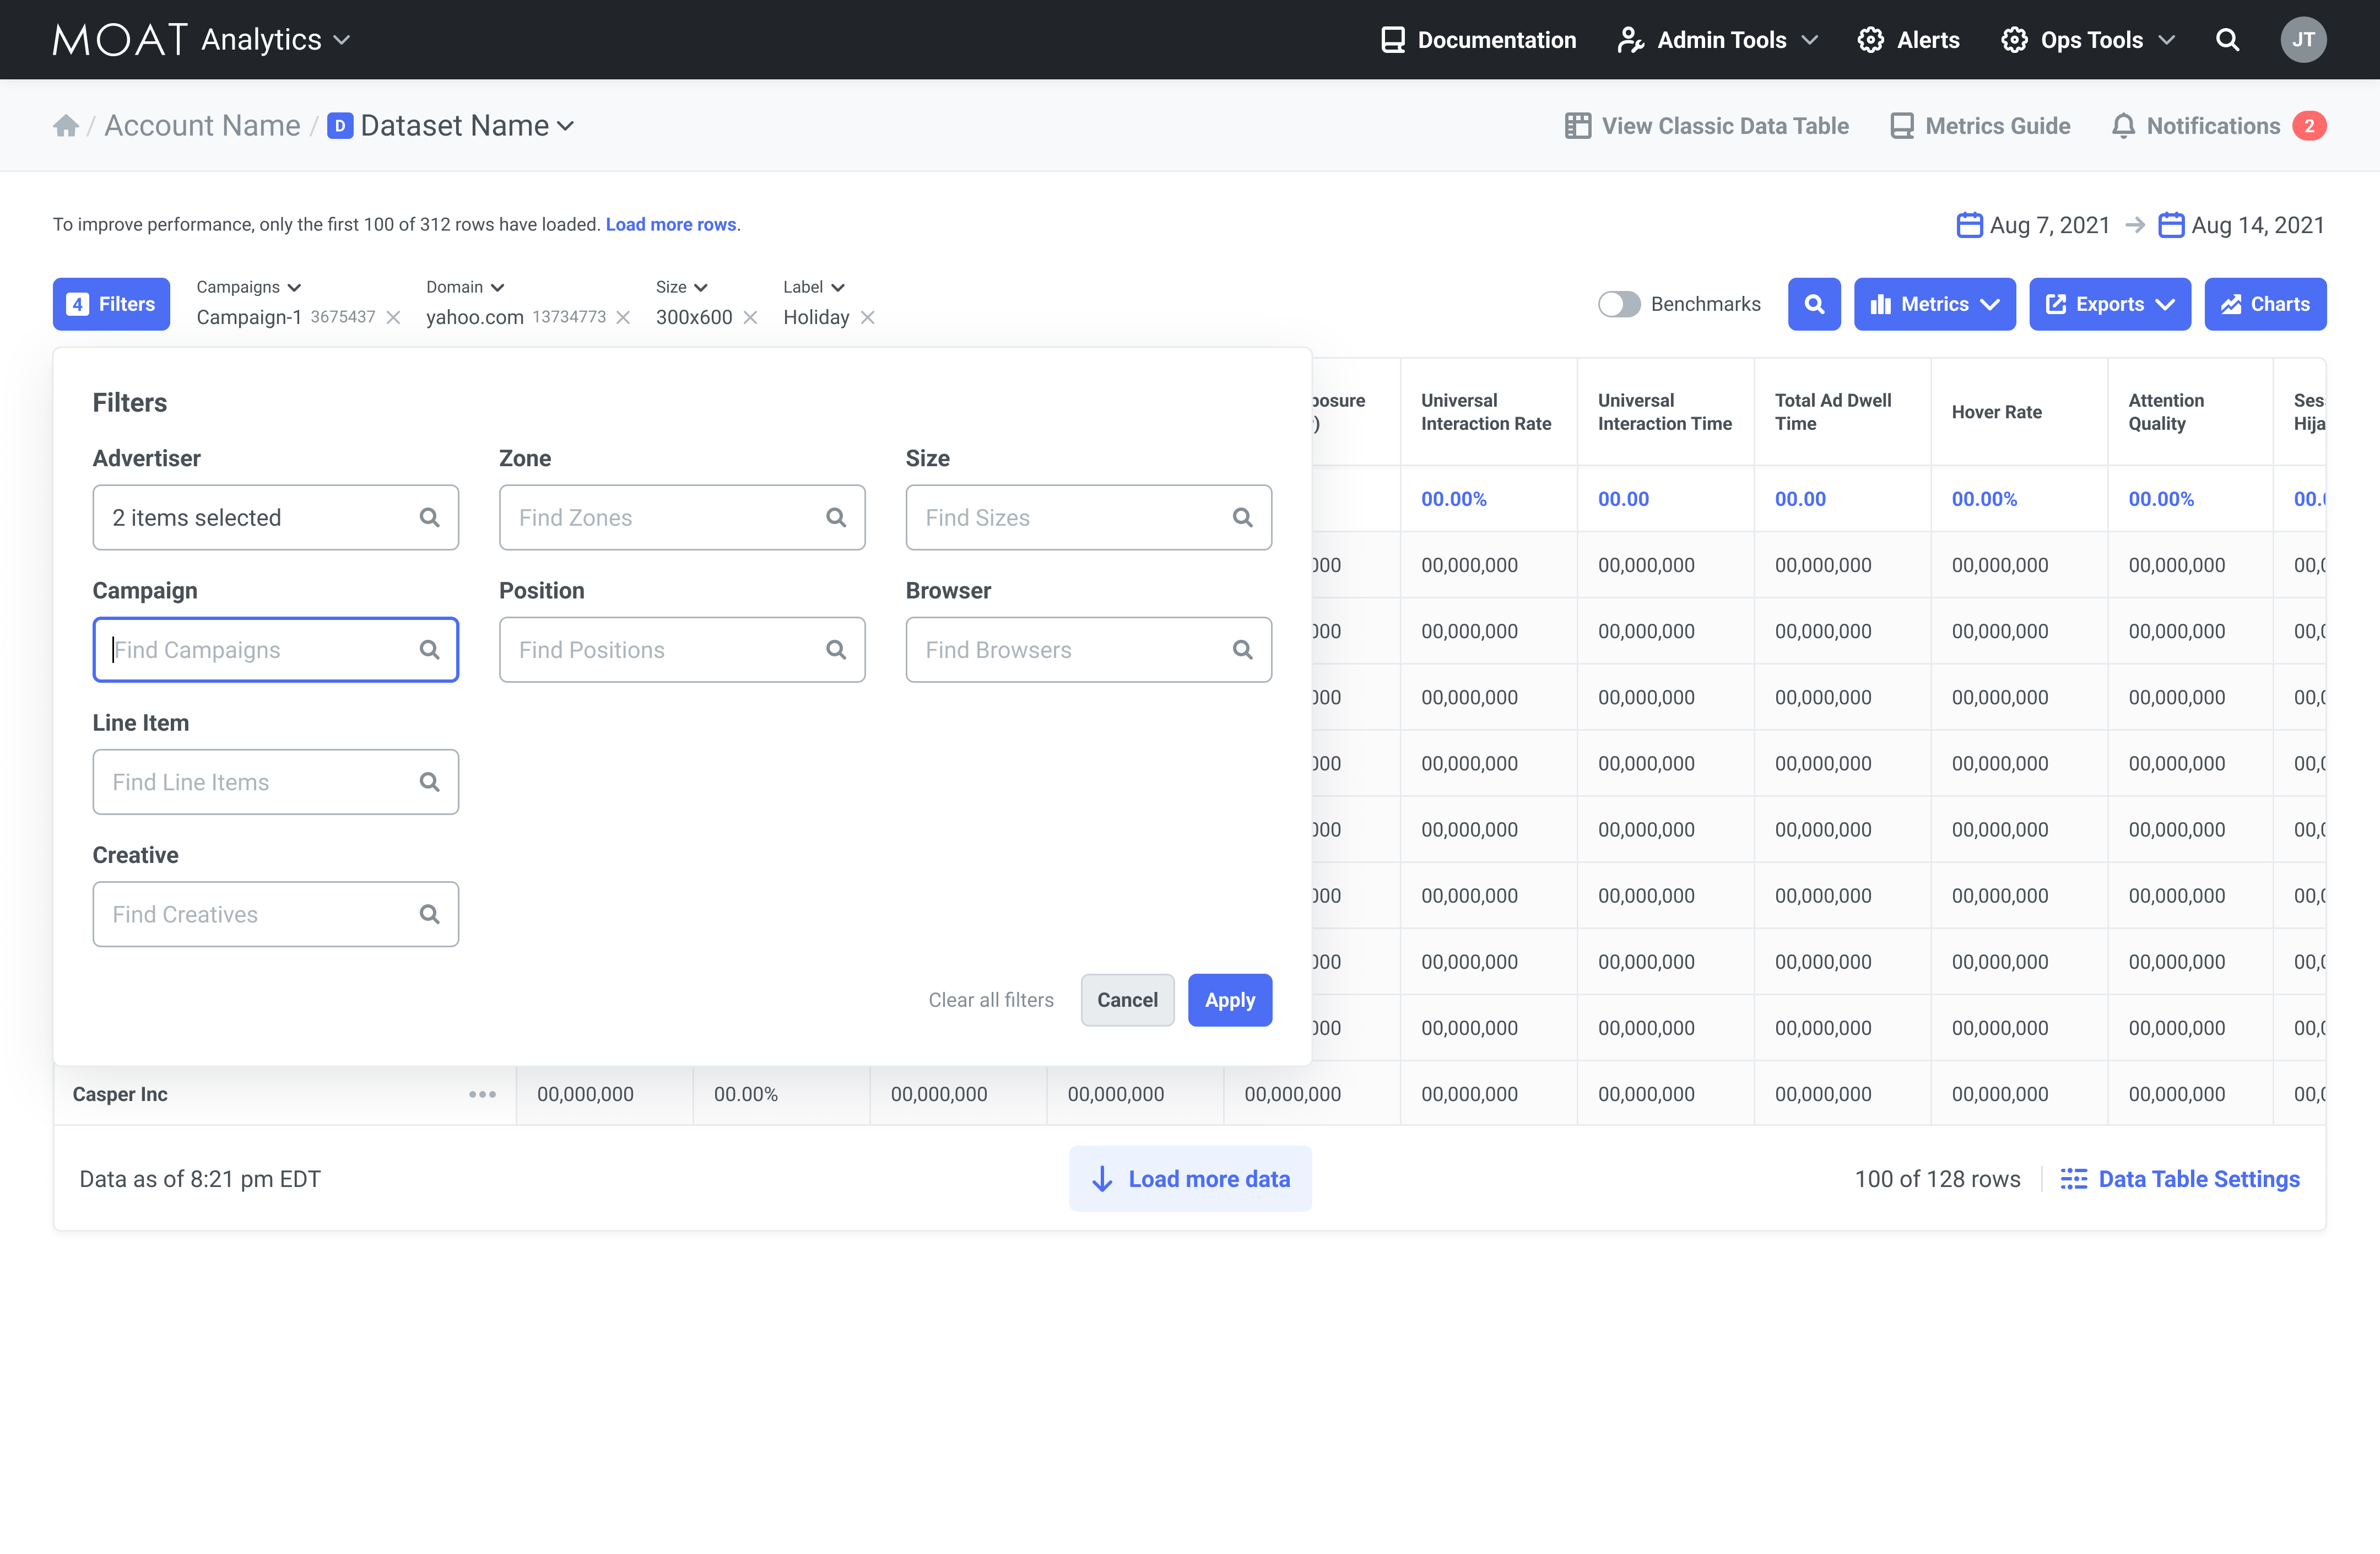
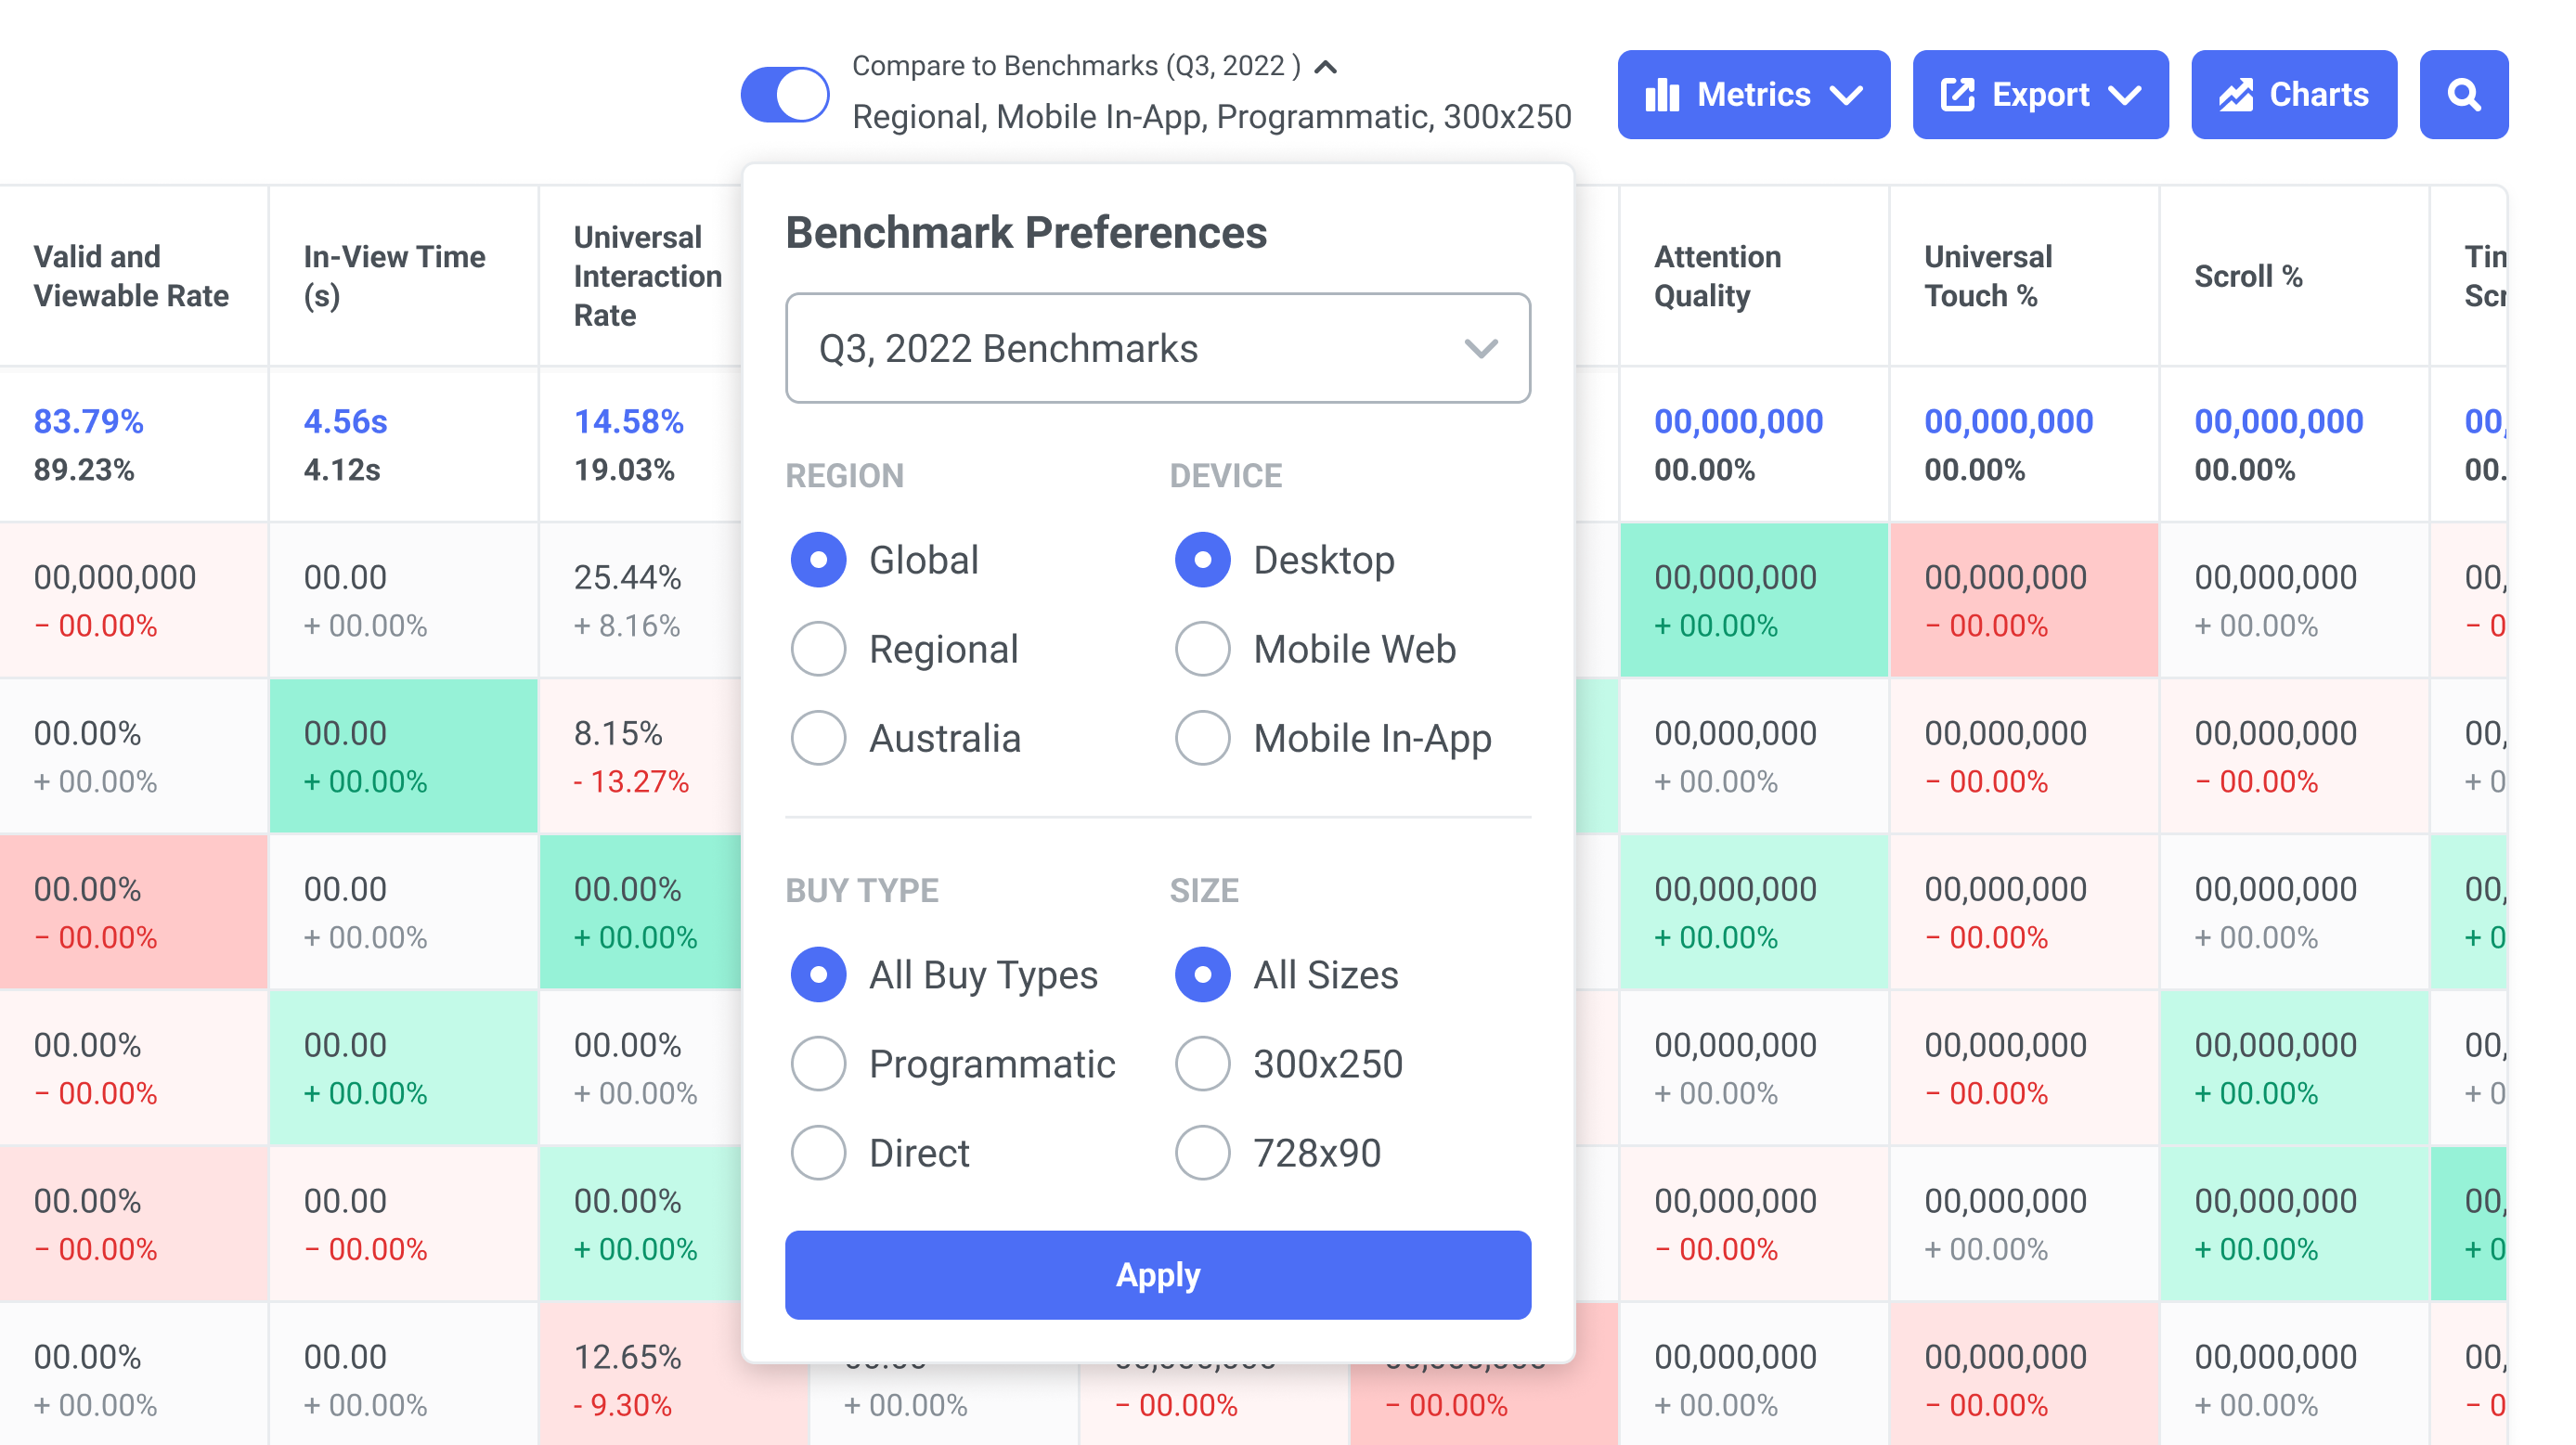
- Granular control: More flexible filters and data cuts.
- Export versatility: Expanded format options for external reporting.
- Perceived performance: Addressing UI lag during complex queries.
Defining the Audience
The highest response rate came from Ad Ops Specialists and Media Buyers. These power users relied on Moat Analytics daily or weekly to verify campaign performance, track viewability, and build client reports. We prioritized recruiting people in these roles for the testing phase.
Strategic Ideation
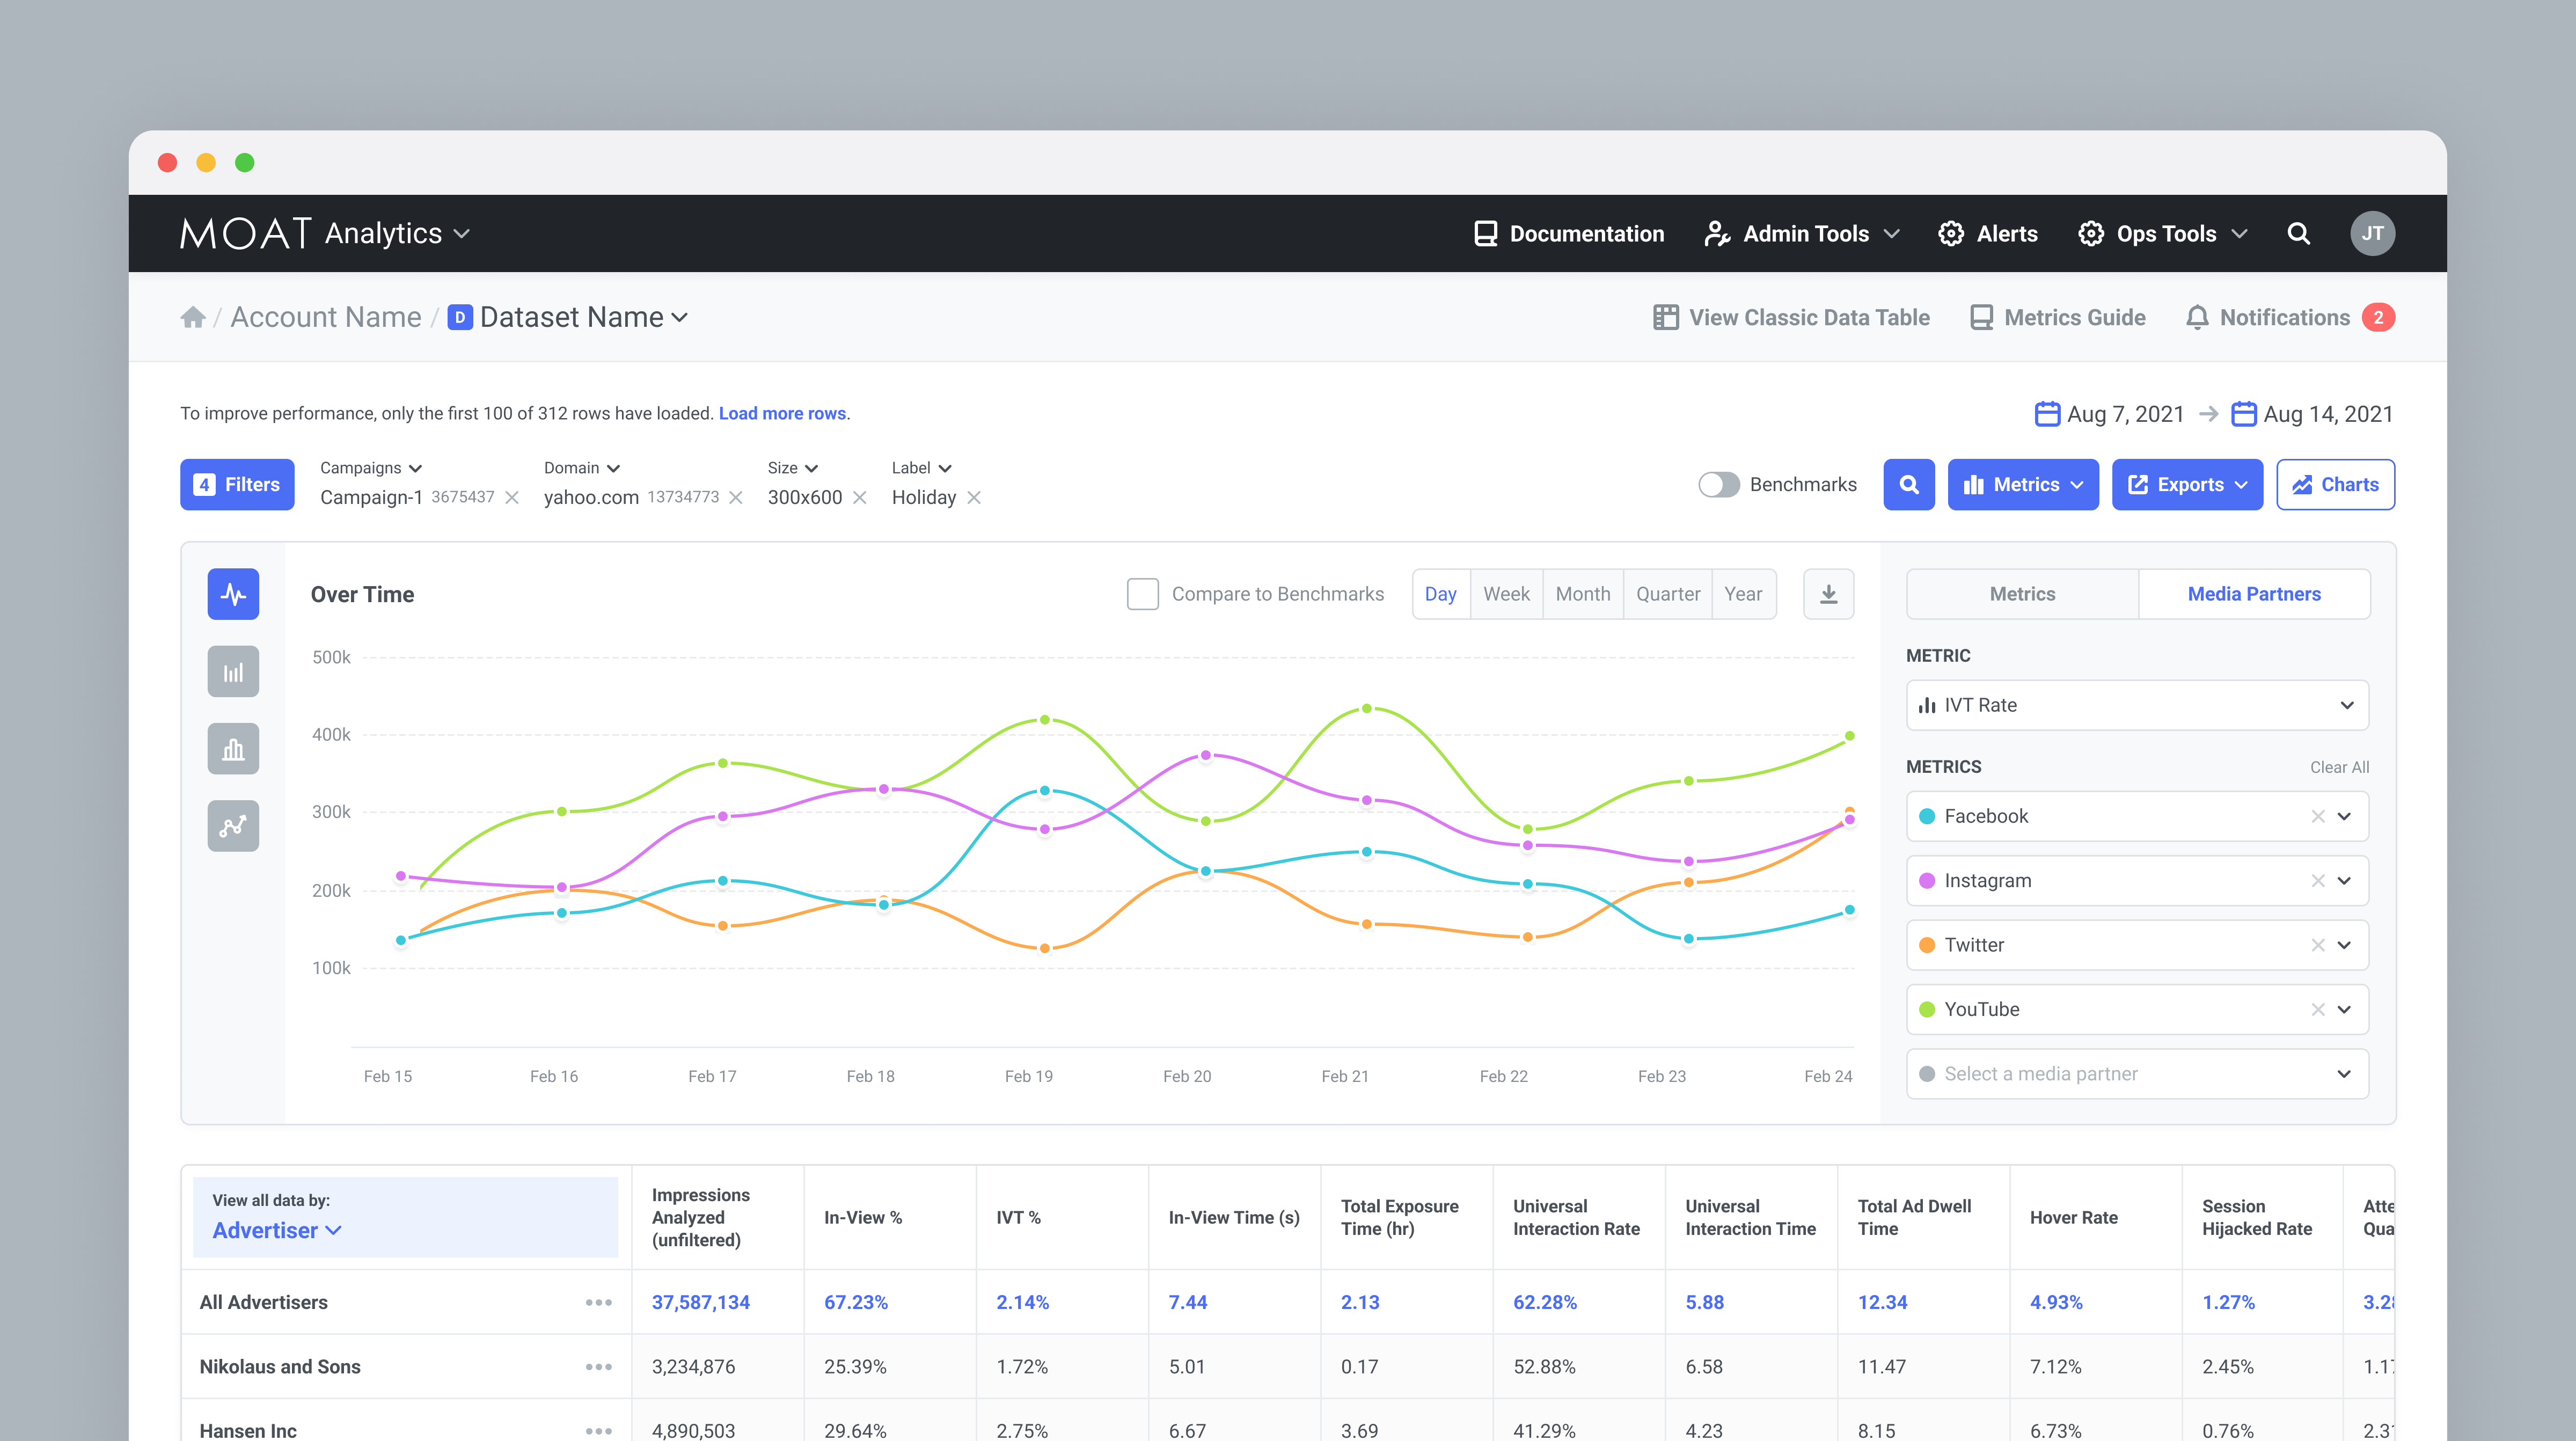
We audited how competitors and analogous products visualize large datasets and found most approaches to be dated. That pushed us to develop novel interactions built specifically around our platform's data structure and user needs.
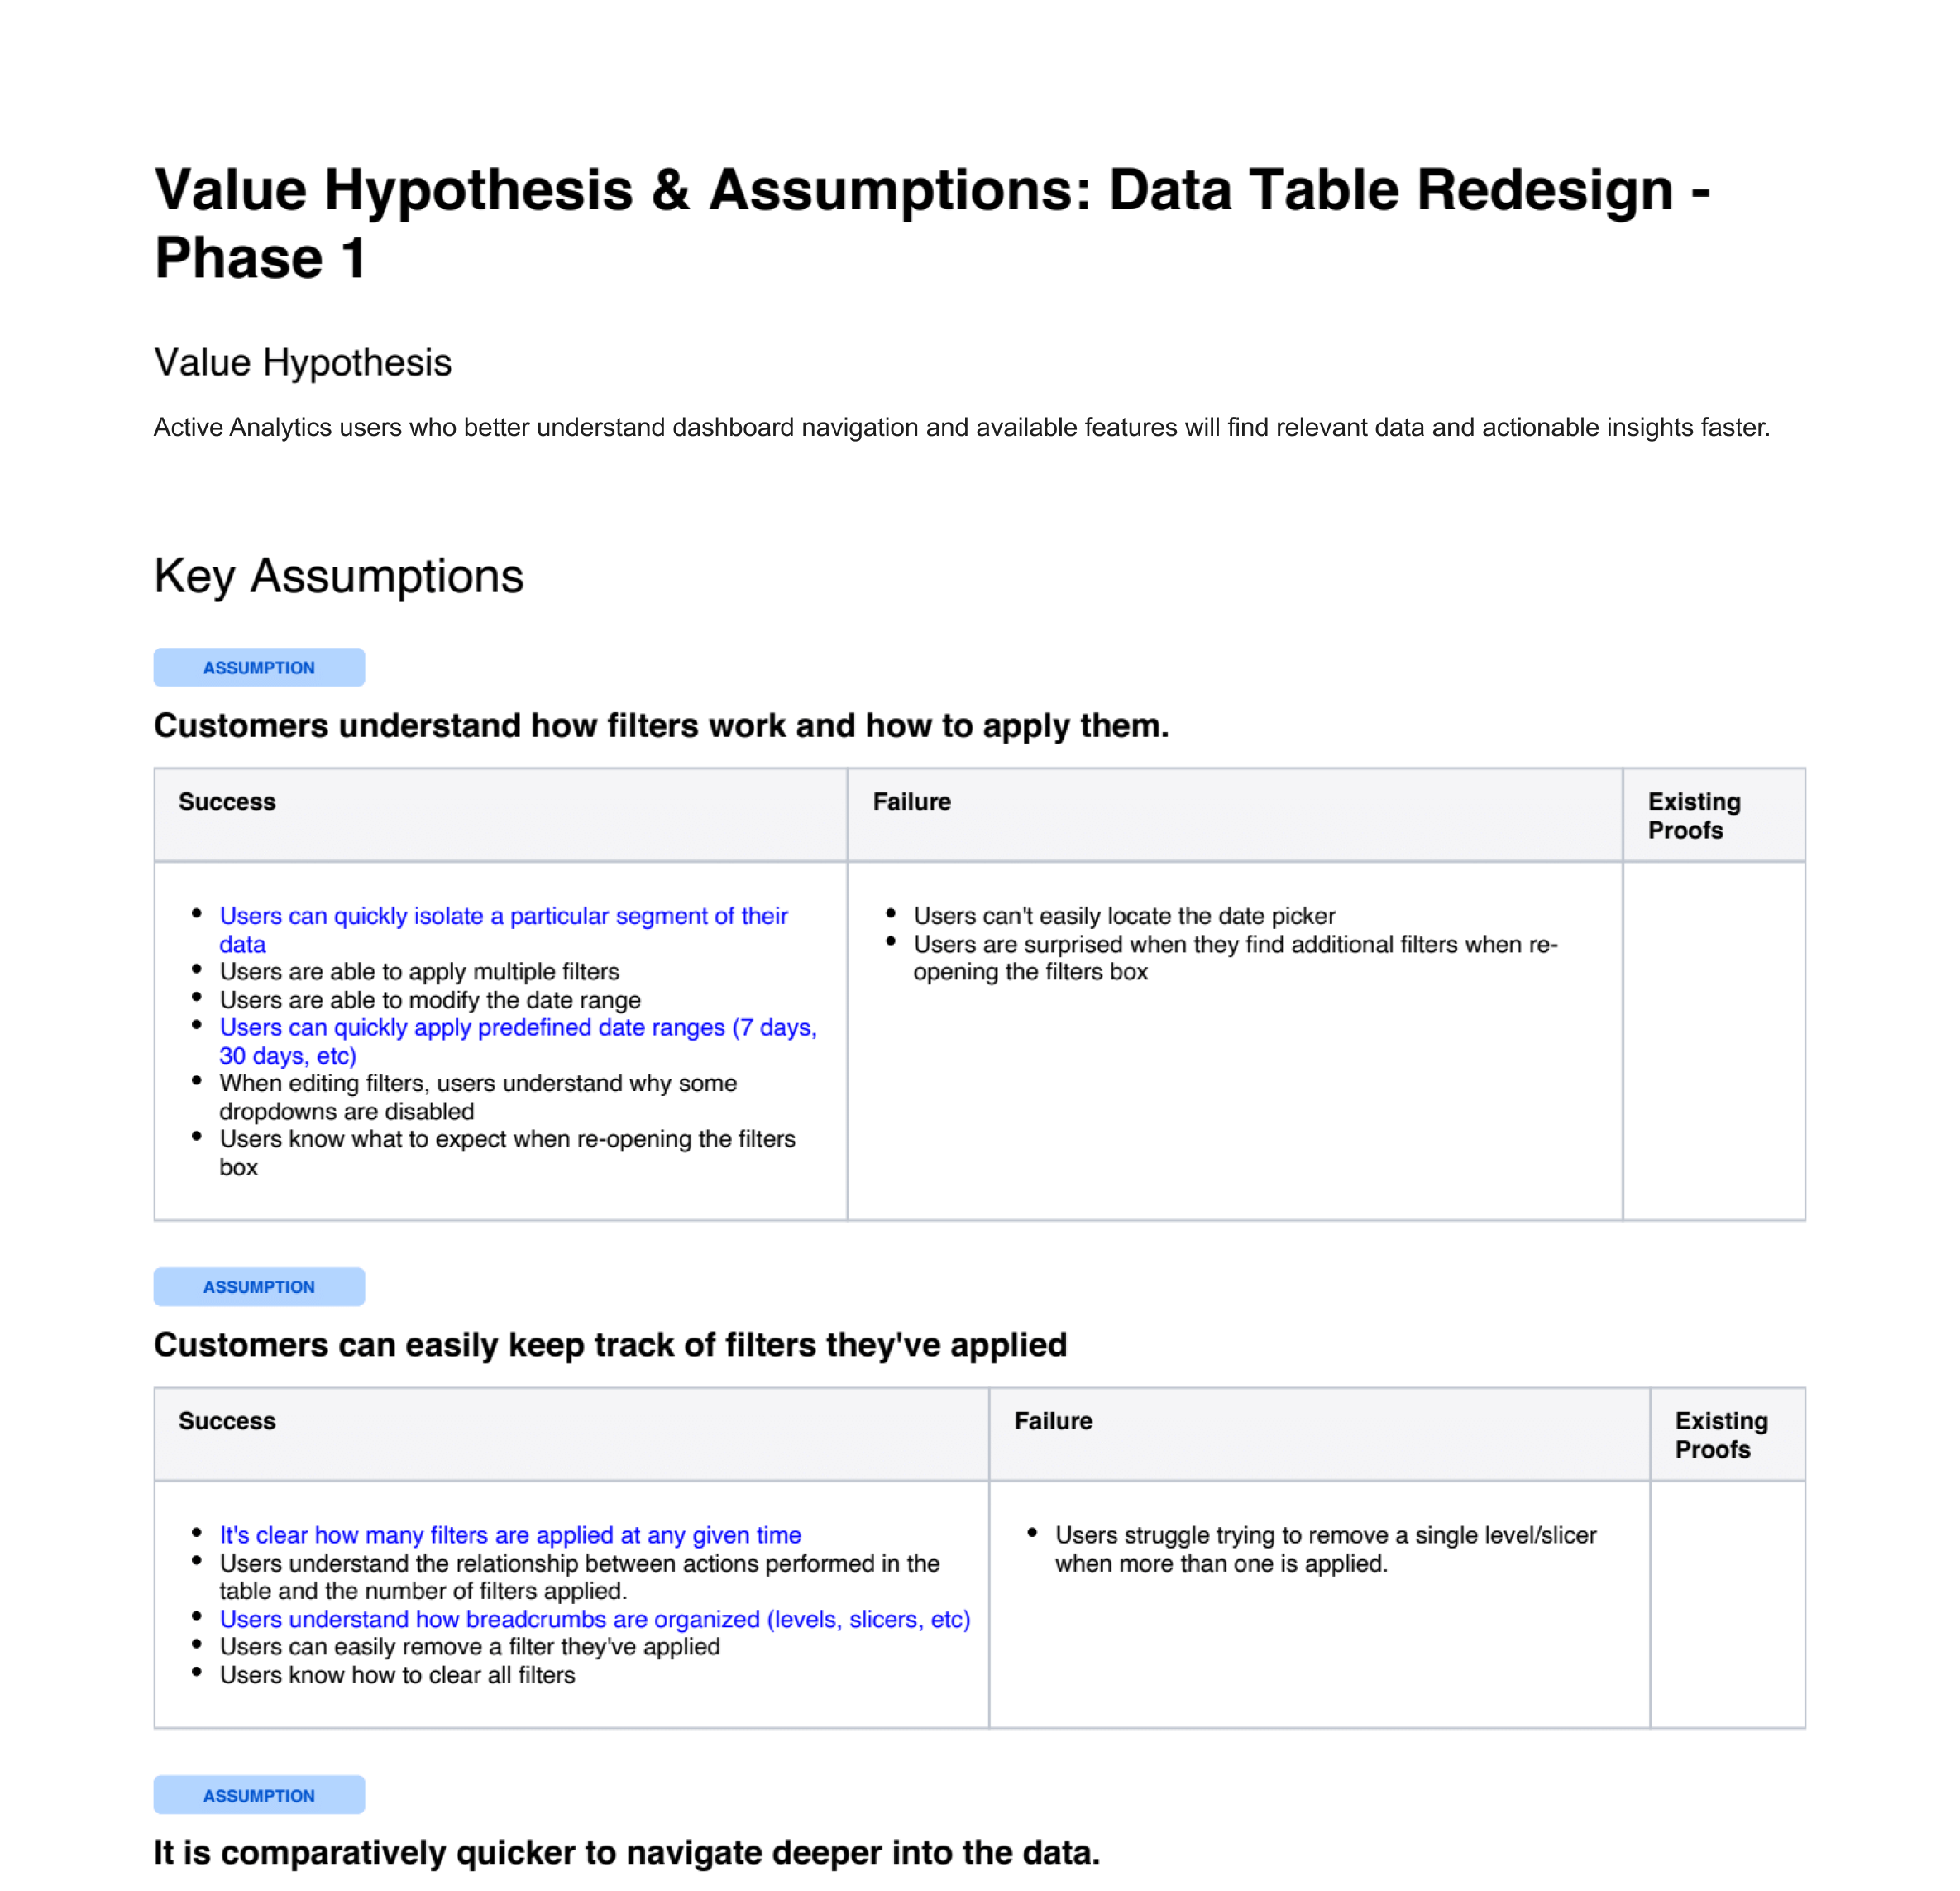
Hypothesis-Driven Testing
We defined a set of testable assumptions to measure how well our solutions addressed each priority:
- Filter logic: Users can retrace their steps after a deep data dive.
- Breadcrumb persistence: Users can trace their steps back out of a deep data dive.
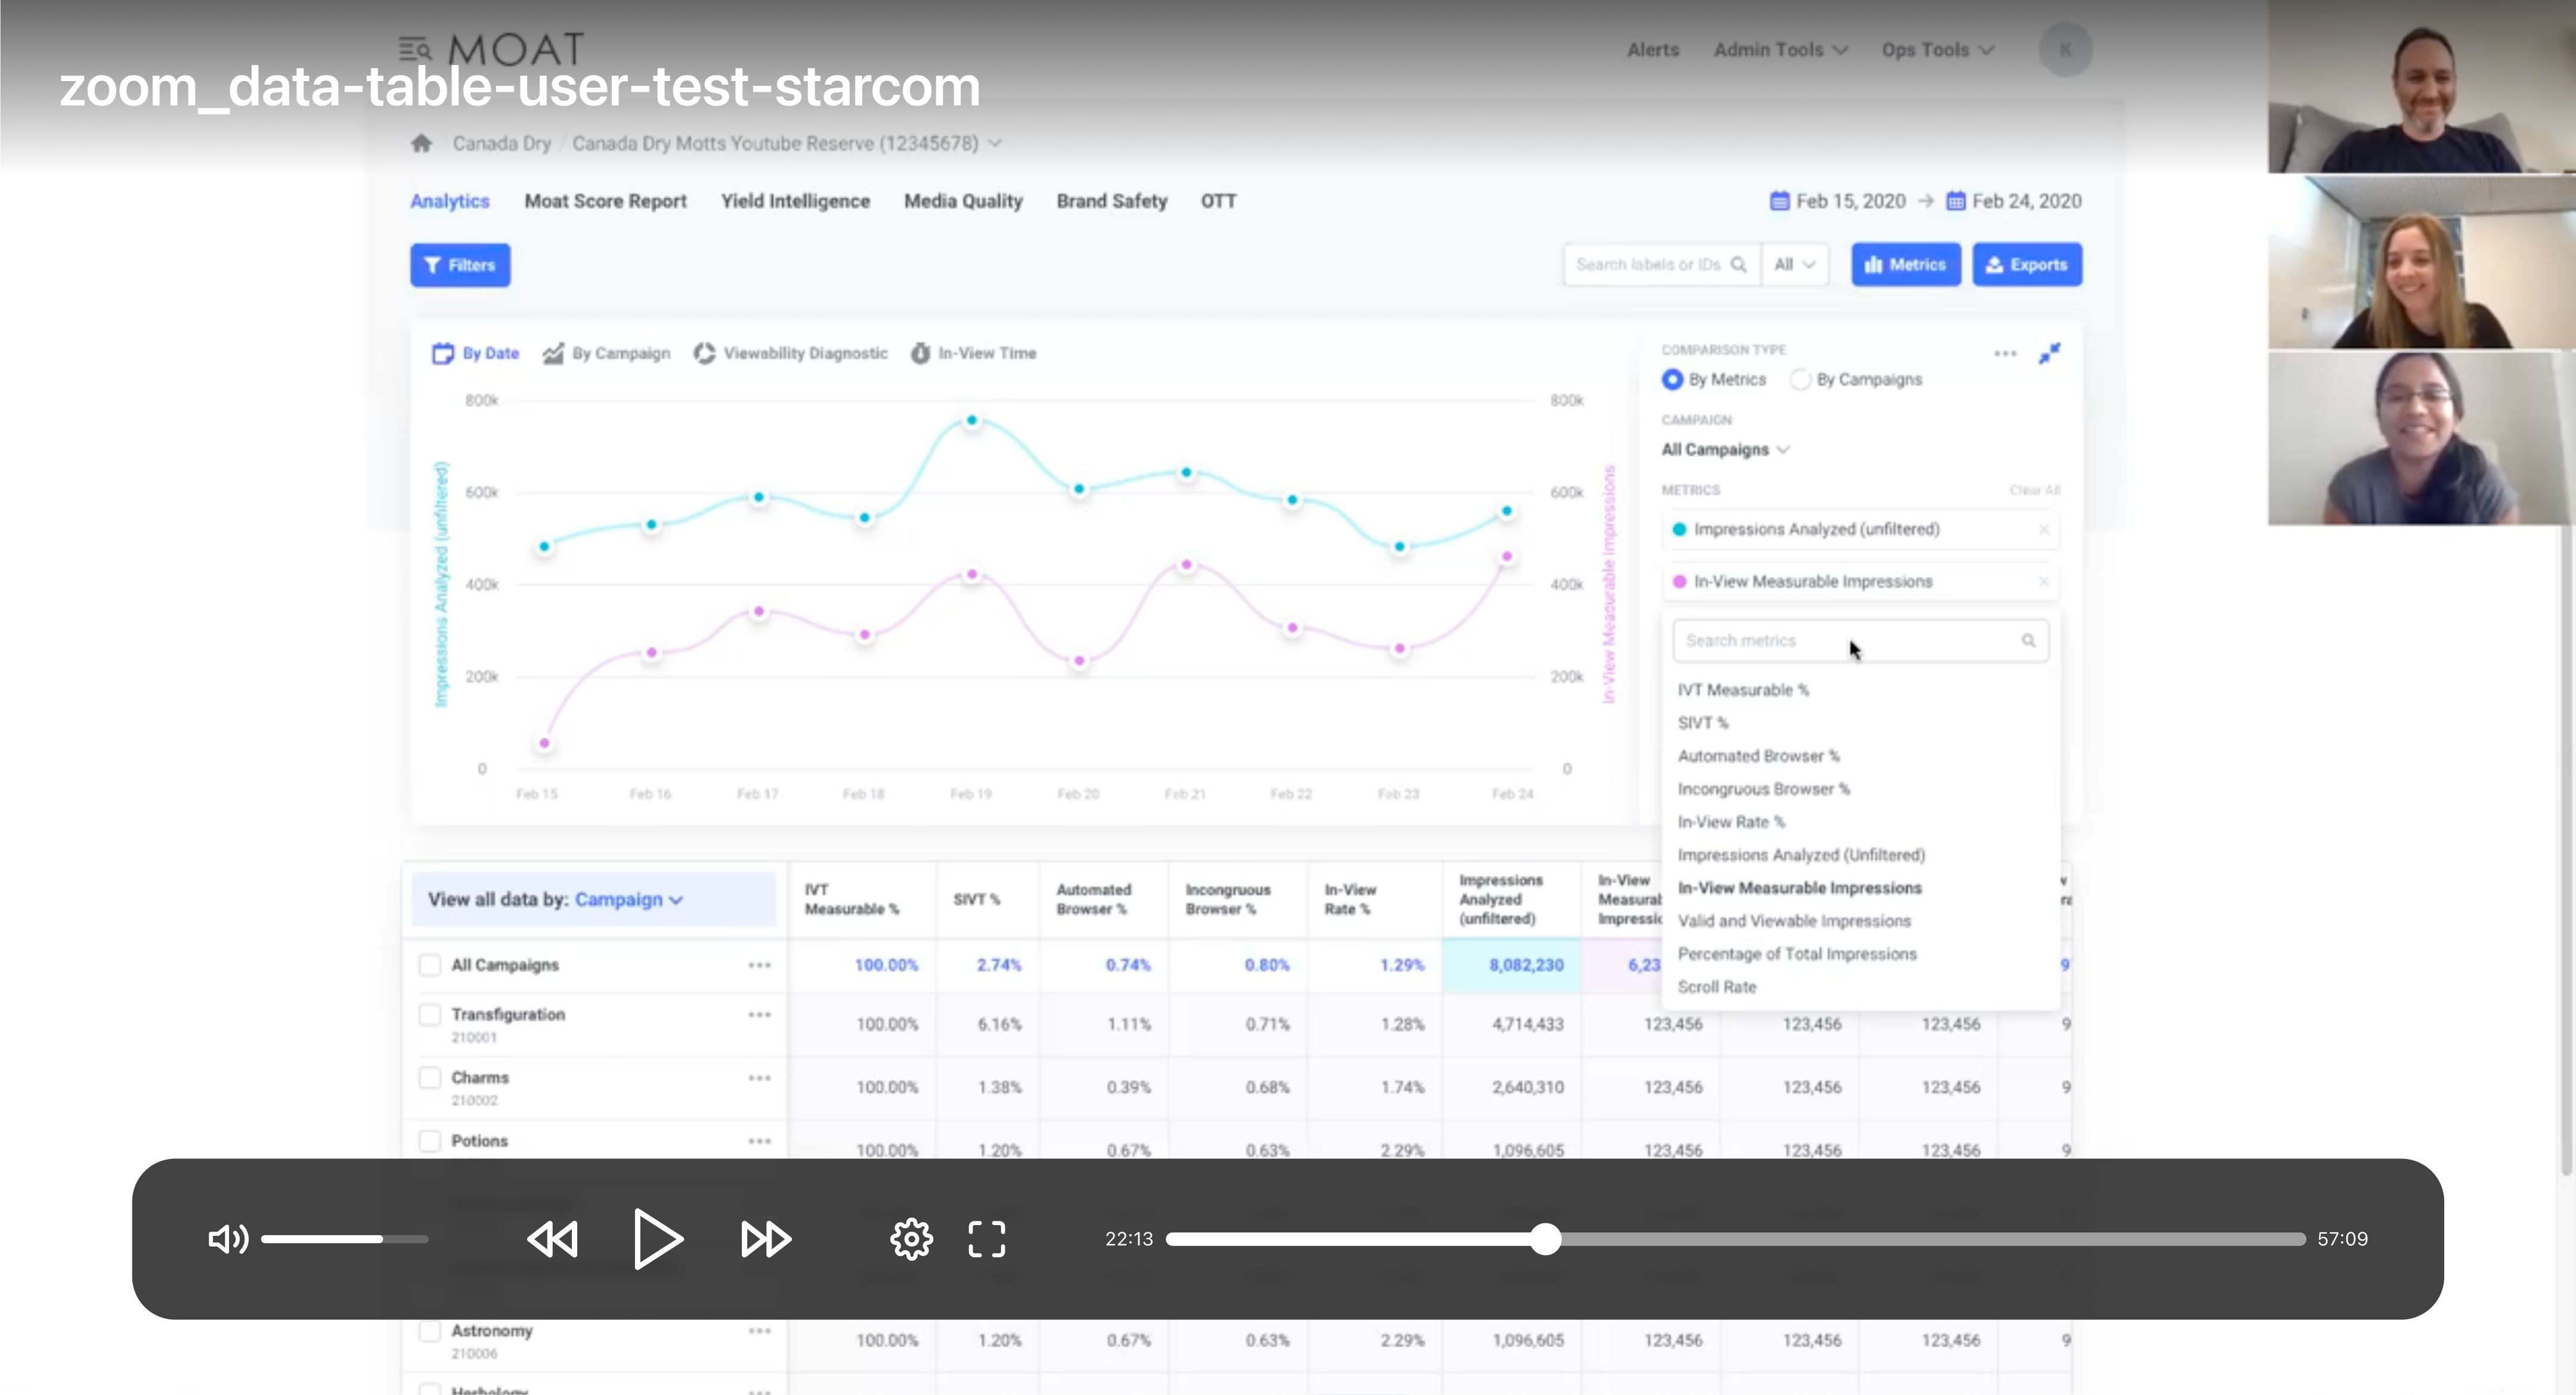
- Dimension shortcuts: Users discover the new "quick-switch" toggles.
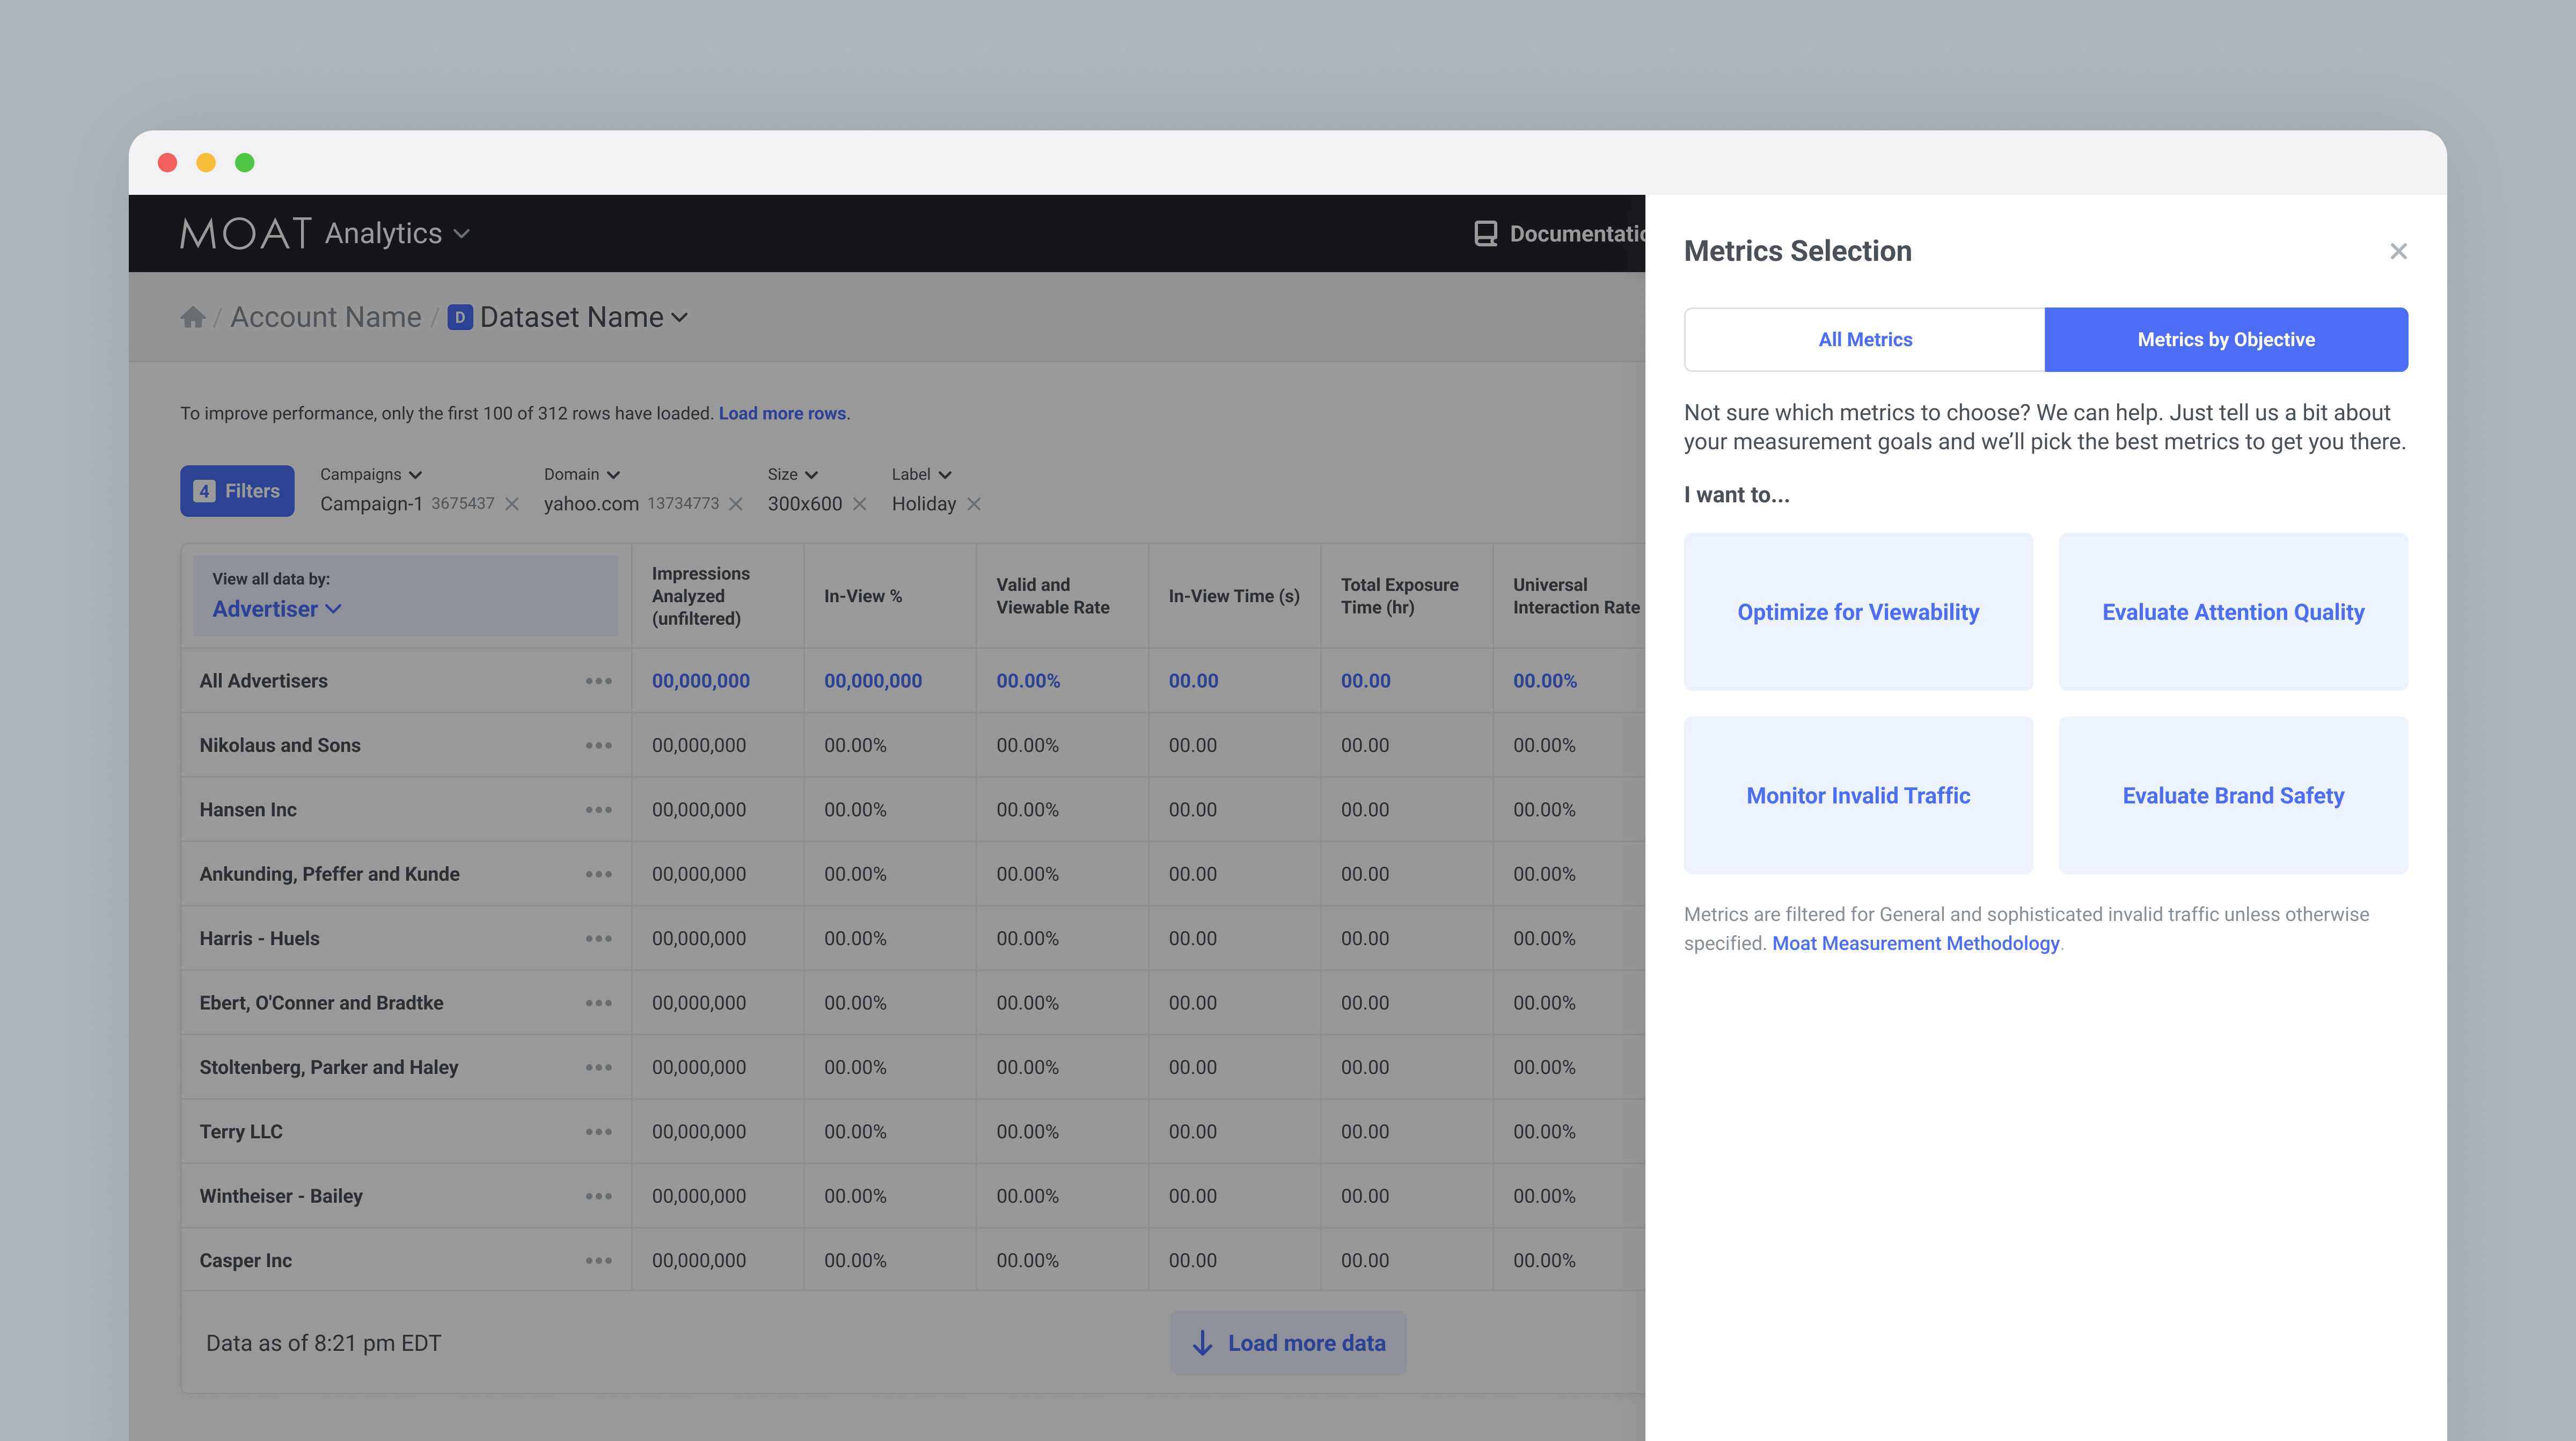
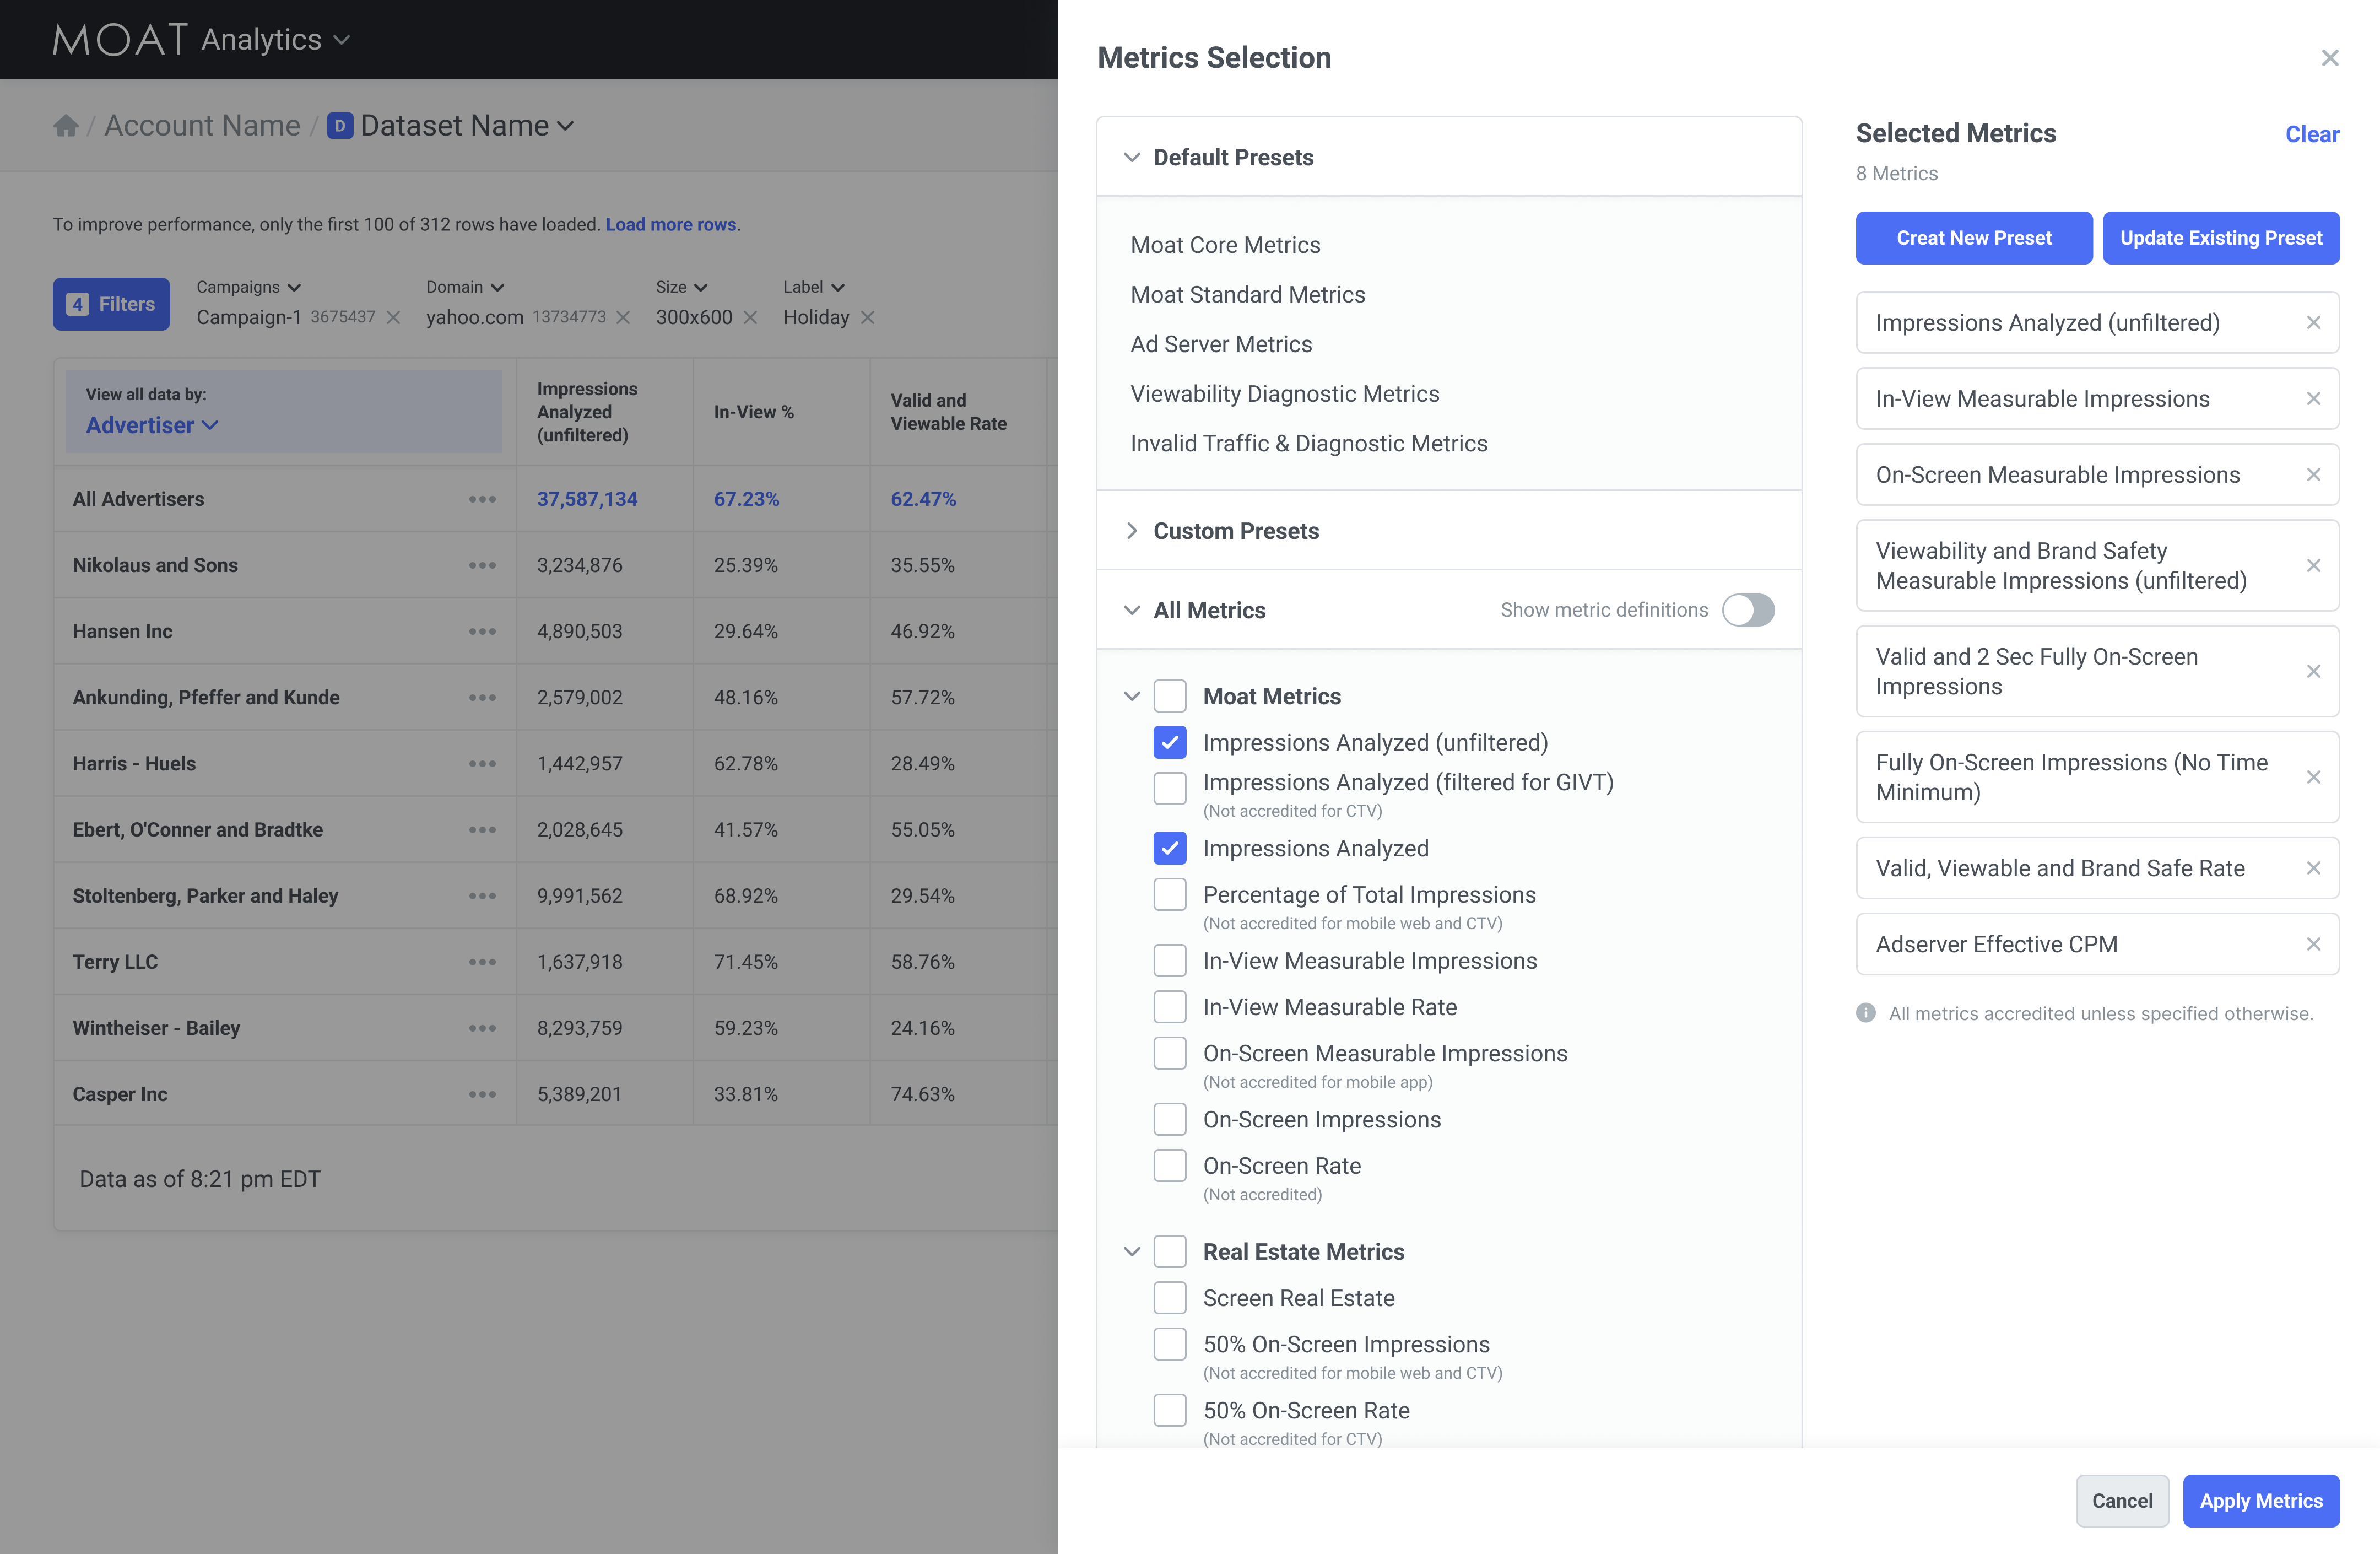
- Custom presets: Users understand how to create and manage metrics and presets.
Iteration & Execution
Working in two-week sprint cycles, we delivered design updates to the dev team for incremental rollout.
Results
- Usability testing confirmed that core features were easier to locate, and frequent actions like drilling into data and swapping metrics were completed significantly faster with the addition of shortcut actions.
- Users reported feeling more in control and spending less time hunting for specific data.
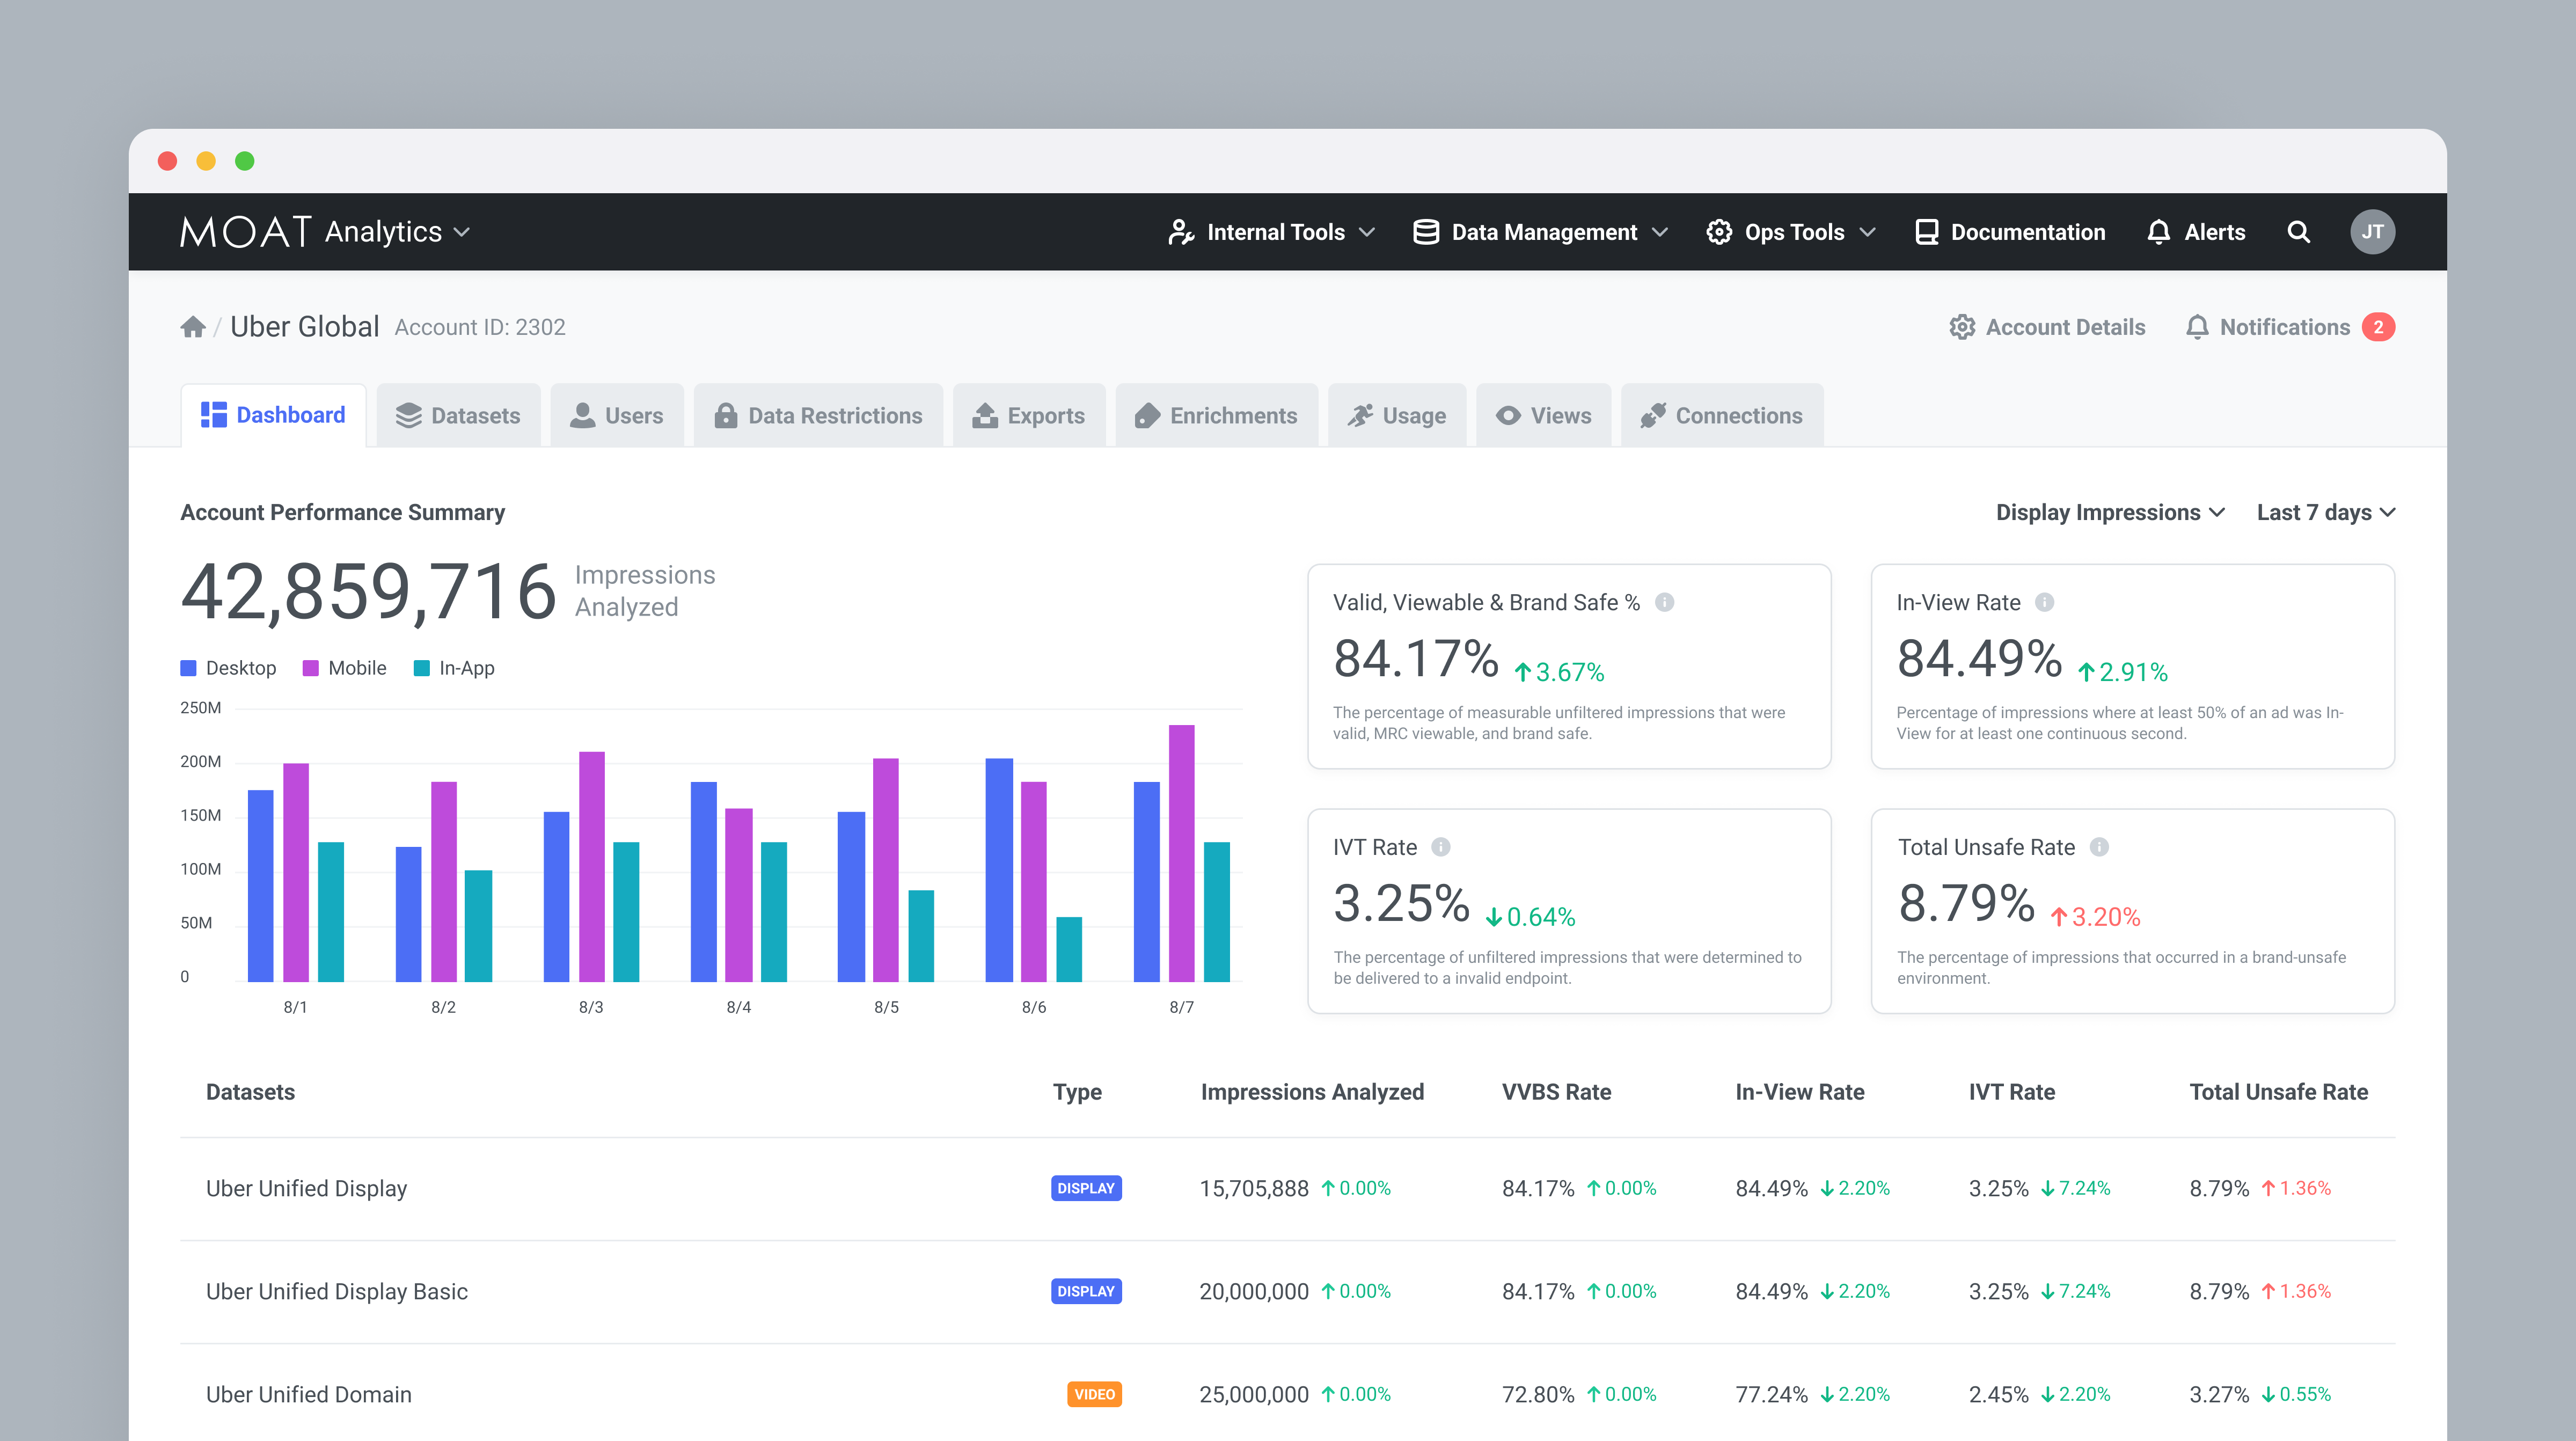
- Navigation improved, but some users felt the product still didn't do enough to surface or automate key insights, which was critical for timely optimization.
Key Takeaways
A new respect for in-product surveys. The high response rate and depth of feedback showed that when timed well, users are willing to be partners in the design process because we asked while they were actively feeling the pain.
Defining success and failure criteria before testing made synthesis faster, kept the team honest, and kept stakeholders aligned.